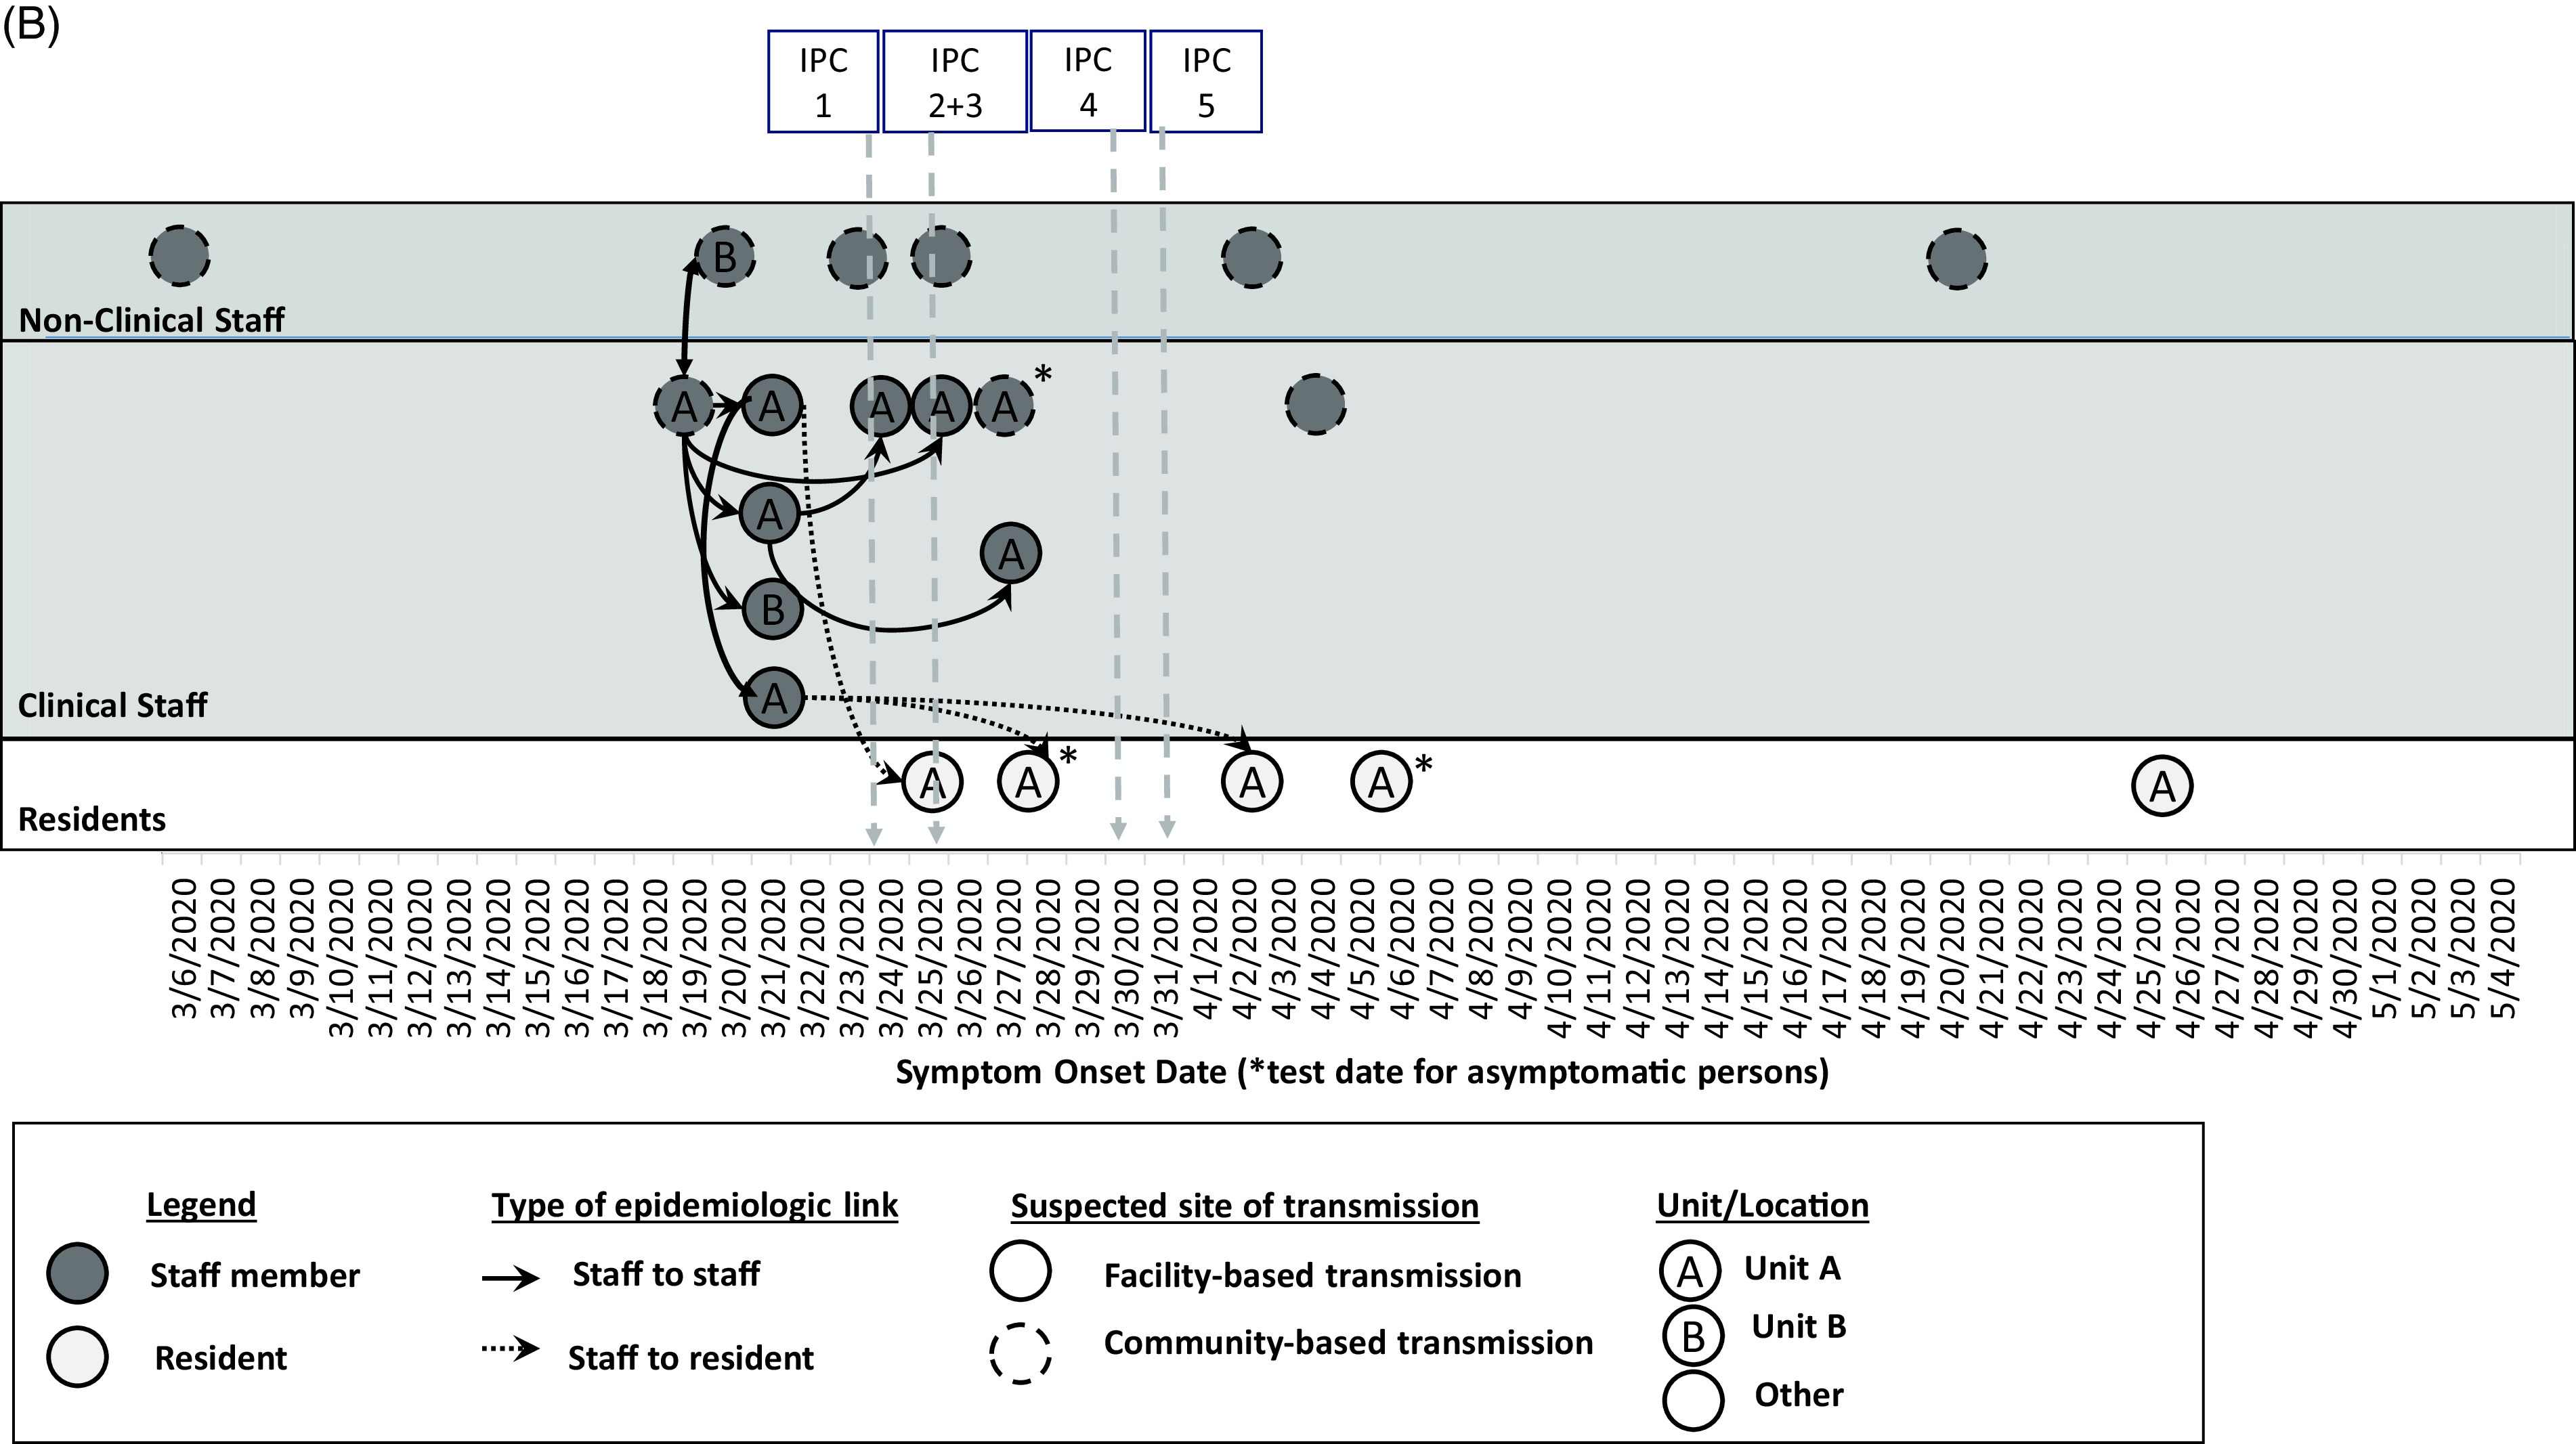
Fig. 1.

B. Epidemiologic linkages among laboratory-confirmed COVID-19 cases in the context of the infection prevention and control (IPC) intervention timeline (per Fig. 1A). Confirmed cases among non-clinical staff (n = 6) and clinical staff (n = 10) marked in dark gray, and residents (n = 5) marked in pale gray, are plotted by symptom onset date or by test date, if asymptomatic (*) as in Fig. 1A. Further epidemiologic data include type of epidemiologic link (staff to staff transmission in solid lines; staff to resident transmission in dotted lines), suspected site of transmission (within facility or within community), and the unit location where the case was identified. The markers at the top of the diagram refer to the timeline of the IPC interventions in Fig. 1A from March 6 to May 4, 2020.
