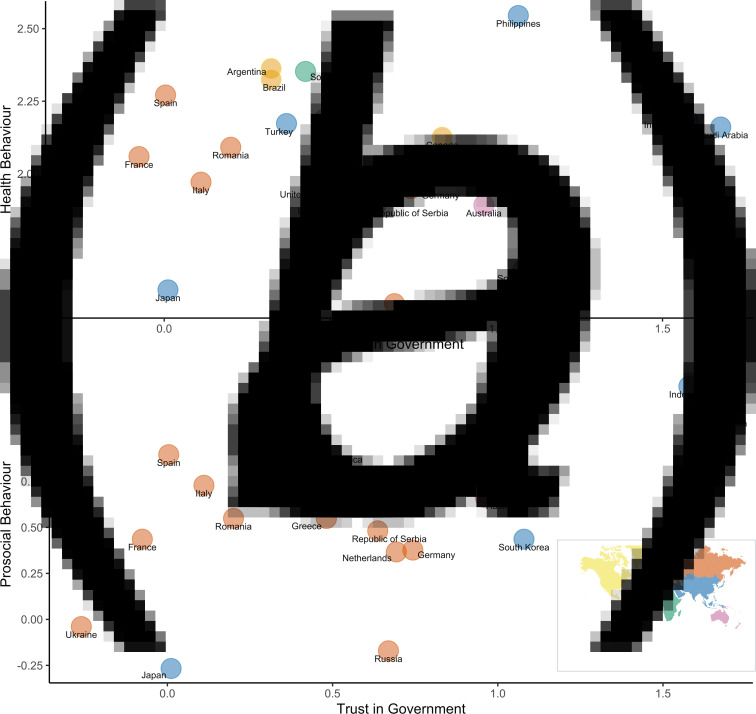
Fig. 2.
Scatter plots of country-level mean values of health behaviour items (a) and prosocial behaviour items (b) against mean values of trust in government items.
Note. Data on 23 countries from the five continents are displayed as circles in each plot. Each colour corresponds to a particular continent. Three items on trust in government were harmonised into 7-point scale from −3 (strongly disagree) to 3 (strongly agree); three items on health behaviour and four items on prosocial behaviour were in similar scale from −3 to 3.

