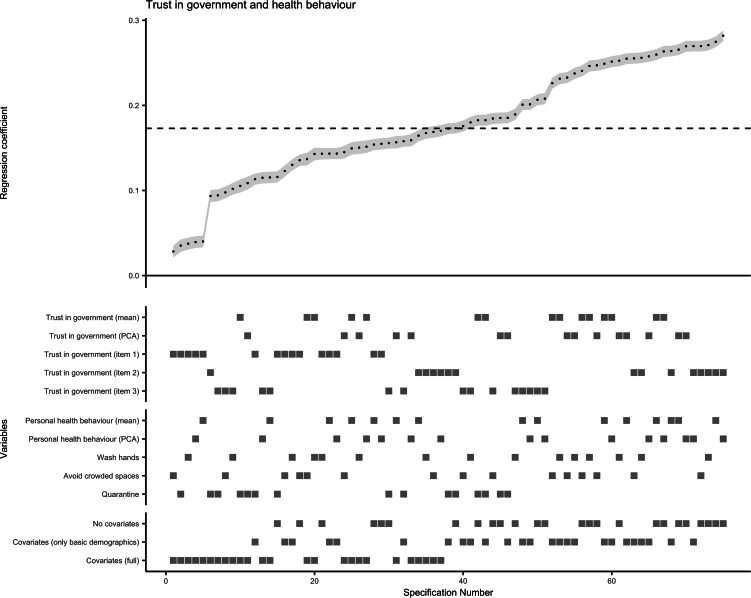
Fig. 3.
Results of specification curve analysis for trust in government and adoption of personal health behaviour.
Note. The standardised β coefficients for the association of trust in government with health behaviour obtained from all 75 specifications (listed on the x axis) are plotted at the upper half of the graph. Each point represents the standardised β coefficient of one specification, and the error bar (in grey) represents the corresponding standard error. The dashed line indicates the median standardised β coefficient (median standardised β = 0.173, median standard error = 0.007, median sample size = 23 693). At the lower half of the graph, the corresponding specifications for each level of the three model specification factors are displayed as squares.

