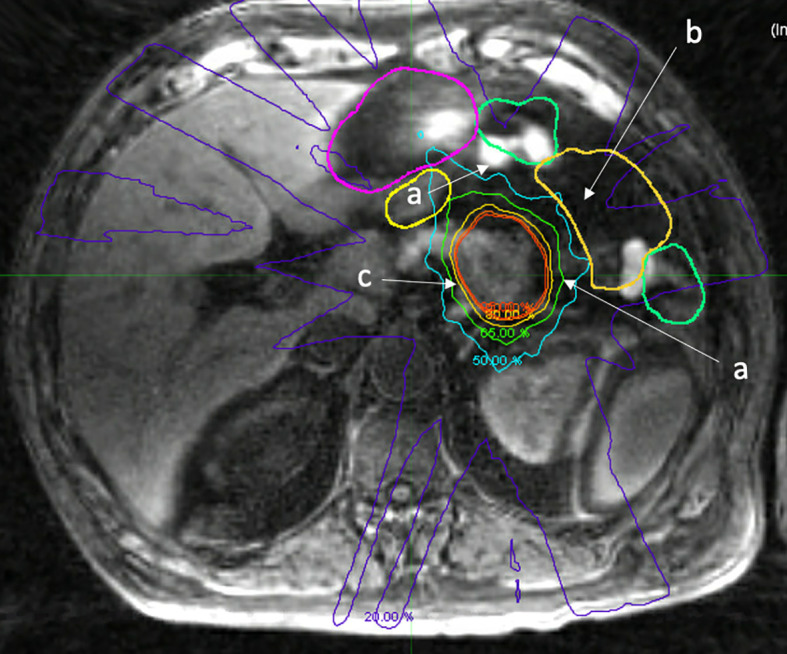
Figure 4.

Fat suppressed T1 image acquired on a 1.5 Tesla MR Linac immediately after treatment delivery highlighting normal organ movement during treatment that reflects uncertain dosimetric consequences. a. Movement of small bowel during treatment, differing from adapted contours (green, yellow). b. Void of small bowel that opened during treatment, actual RT dose to small bowel is likely not accurately measured, despite daily adaption. c. Isodose lines highlighting prescription dose with fall off.
