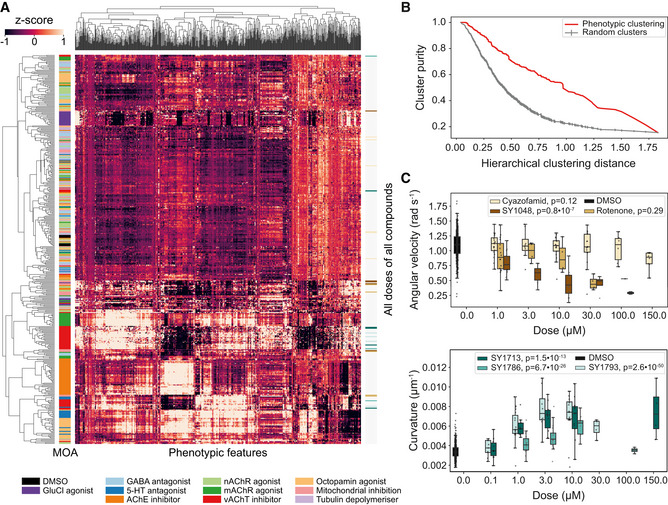
Figure 2. Clustering and dose response of behavioral fingerprints.

- Hierarchical clustering of behavioral fingerprints highlights structure in the responses to different compounds. Each row of the heat map represents the mean dose fingerprint of a specific compound described by 256 pre‐selected features from each blue light condition. Clear clusters can be observed for some compound classes, e.g., AChE inhibitors, vAchT inhibitors, GluCl agonists, and mAchR agonists. Low doses and low potency compounds from different classes cluster together around the DMSO averages at the center‐top part of the heat map.
- Cluster purity as a function of the hierarchical cluster distance shows that the degree of mode‐of‐action clustering (red) is greater than expected by chance for random clusters (gray).
- Compounds in the same class can have different dose–response curves. (upper) The three mitochondrial inhibitors cyazofamid, rotenone, and SY1048 all decrease angular velocity, but the concentration at which their effect is measurable is not conserved across compounds. (lower) Different spiroindolines affect body curvature differently. SY1786's dose–response curve is non‐monotonic. The central band and box limits show the median and quartiles of the distribution of the biological replicates for each compound dose (on average 12 wells per dose and 601 DMSO wells), while the whiskers extend to 1.5 IQRs beyond the lower and upper quartile. The P‐values reported in the legend represent the significance of the drug dose effect and were estimated using linear mixed models with tracking day as random effect and drug dose as fixed effect. The positions of these compounds in the heat map in (B) are marked using the color bar on the right side of the heat map.
