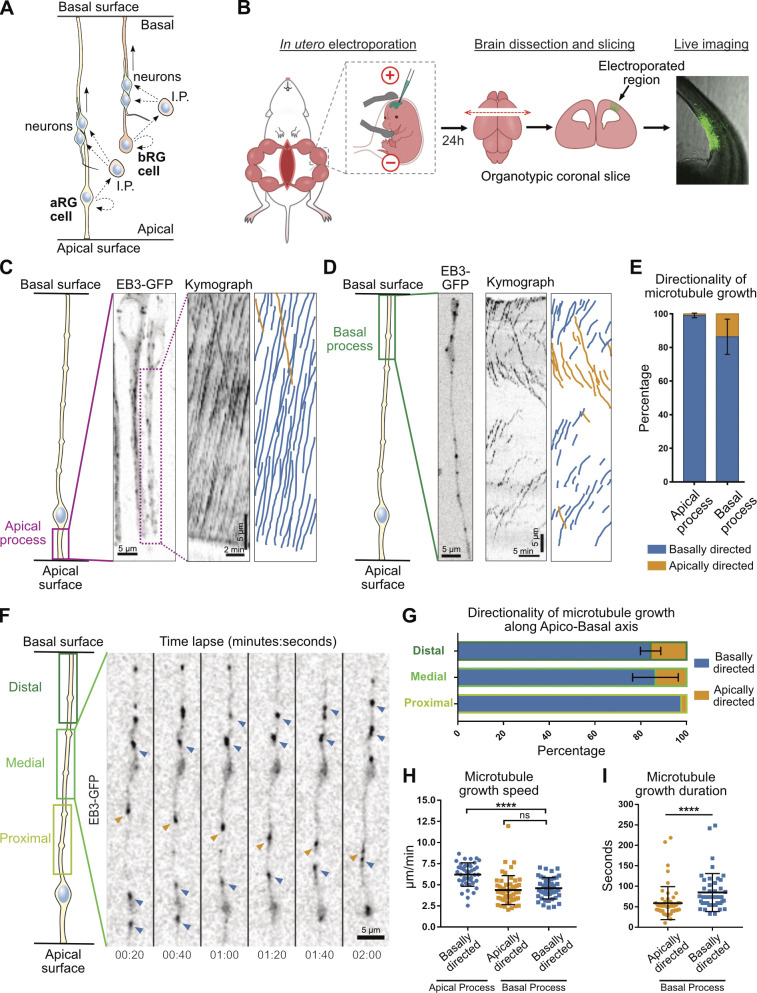
Figure 1.
A bipolar microtubule network in the basal process of aRG cells. (A) Schematic representation of aRG and bRG cells. I.P., intermediate progenitor. (B) Experimental setup. (C) Left: Live imaging of EB3-GFP in the apical process of mouse aRG cells in situ. Center: Corresponding kymograph. Right: Manual tracks corresponding to the kymograph. (D) Left: Live imaging of EB3-GFP in the basal process of mouse aRG cells in situ. Center: Corresponding kymograph. Right: Manual tracks corresponding to the kymograph. (E) Quantification of the average directionality of EB3 comets in the apical and basal processes (n = 302 comets from 28 cells and 827 comets from 104 cells, respectively). (F) Live imaging of EB3-GFP along the apico–basal axis of the basal process of a mouse aRG cell. Blue arrowheads indicate basally growing microtubules, and orange arrowheads indicate apically growing microtubule. (G) Quantification of EB3 comet directionality along the proximo–distal axis of the basal process (n = 90 comets from 6 cells in apical; 141 comets from 12 cells in medial; and 198 comets from 12 cells in basal). (H) Quantification of the average speed of apically and basally directed EB3 comets in the apical and basal processes (n = 40, 52, and 45 comets from 11, 20, and 15 cells, respectively). (I) Quantification of the average growth duration of apically and basally directed EB3 comets in the basal process (n = 52 and 45 comets from 20 and 15 cells, respectively). Error bars indicate SD. ****, P < 0.0001 by Mann-Whitney tests. All experiments were performed in at least three independent mice.

