Figure 2.
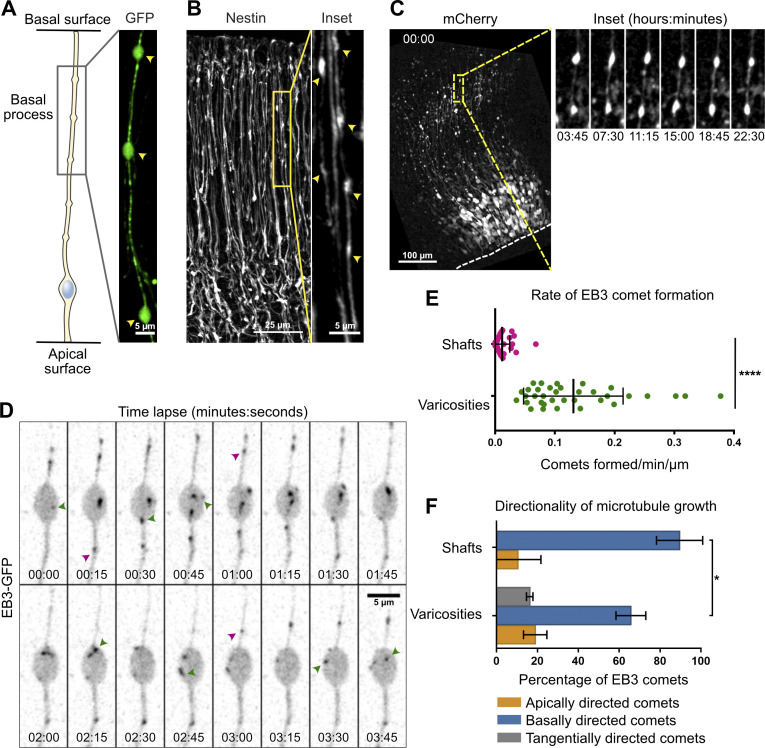
Acentrosomal microtubules preferentially grow from varicosities of the basal process. (A and B) The basal processes of aRG cells display varicosities (arrowheads), visualized by overexpression of GFP (A) and immunofluorescence against Nestin (B). (C) Live imaging of mCherry-expressing mouse aRG cells reveals stable varicosities over the course of a 24-h movie. Dashed line marks apical surface. (D) Live imaging of EB3-GFP in the basal process of an aRG cell showing the emergence of new comets within a varicosity. Green arrowheads: newborn comets in the varicosity. Purple arrowheads: newborn comets in the shaft. (E) Quantification of the rate of EB3 comet formation in basal process shafts and varicosities, normalized to length (n = 40 shafts and 34 varicosities from 39 cells). (F) Quantification of the average directionality of EB3 comets in the shafts and varicosities of the basal processes (n = 122 comets from 62 shafts and 260 comets from 65 varicosities). (E and F) Error bars indicate SD. *, P < 0.05; ****, P < 0.0001 by Mann-Whitney tests. All experiments were performed in at least three independent mice.

