Figure 2.
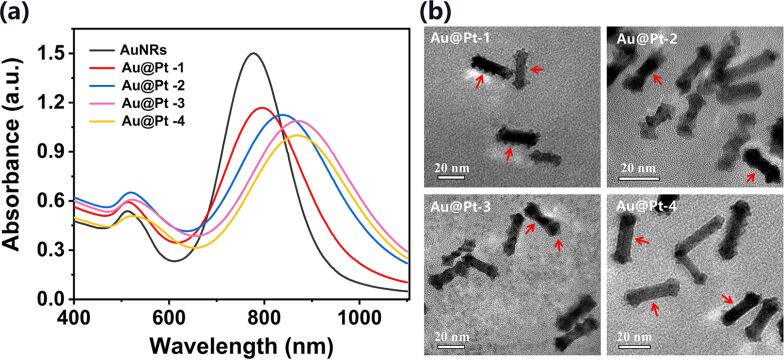
(a) Absorption spectra of AuNRs and of Au@Pt NRs synthesized with different concentrations of Ag+. (b) Corresponding TEM images of different Au@Pt NRs. Annotation: Au@Pt-1, Au@Pt-2, Au@Pt-3 and Au@Pt-4 represent the Au@Pt NRs prepared with different concentrations of added AgNO3: 5, 10, 20, and 40 mM, respectively.

