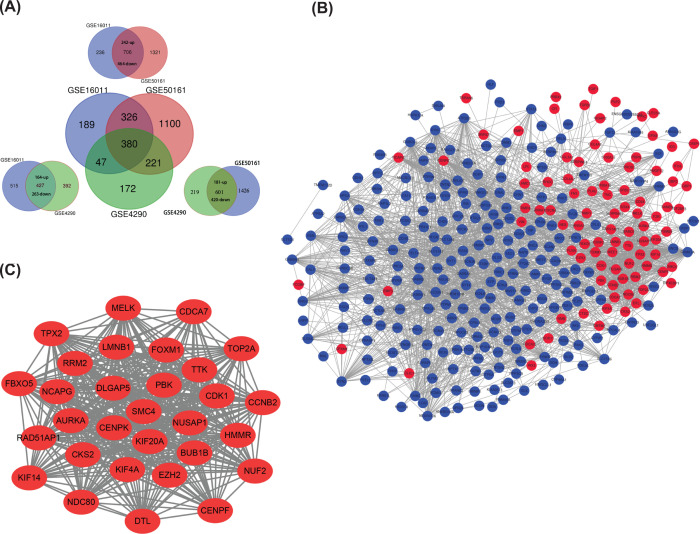
Figure 1. Screening of differential expression genes (DEGs) and extracting of hub genes.
(A) 380 DEGs abnormally expressed in glioma tissues were obtained from the intersection of GSE16011, GSE50161 and GSE4290. The DEGs from each two of the three datasets were shown in the surrounding. (B) PPI network formed by 380 genes. Red was the up-regulated genes and blue was the down-regulated ones. The minimum interaction score in STRING network was 0.4. (C) The hub gene network was analyzed by using MCODE for PPI network. Degree≥15, MCODE scores > 5, degree cut-off = 2, node score cut-off = 0.2, max depth = 100 and k-score = 2.

