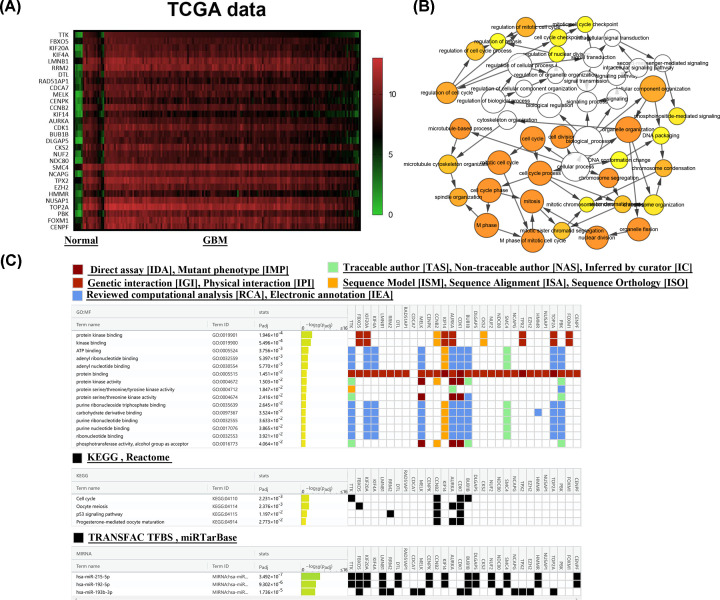
Figure 2. Analysis of the 30 hub genes.
(A) The 30 hub genes were up-regulated in TCGA GBM dataset. (B) The network of GO-biological process analyses of 30 hub genes. The circle size represented gene enrichment degree, and the depth of the color represented the size of the P value. (C) The GO-molecular function analyses, KEGG analyses and corresponding associated miRNAs of the hub genes. The color indicates different data sources and the data were arranged according to the size of P value. Result was from the website: g: profiler.

