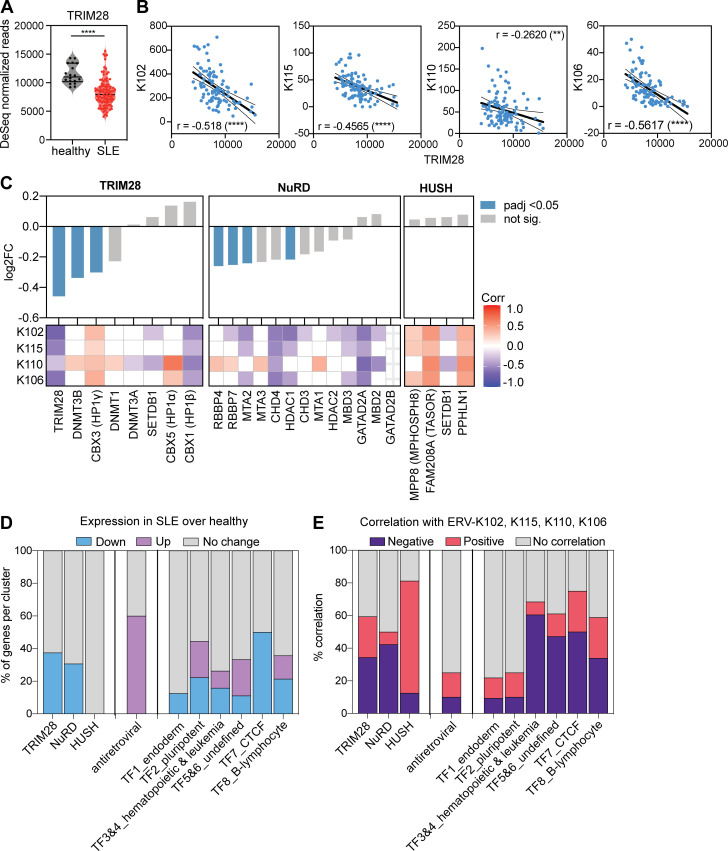
Figure 2.
Elevated ERV-K expression correlates with reduced epigenetic repressor expression. Using the same RNA-seq dataset as the ERVmap analysis, the cellular transcriptome was analyzed. (A) Read counts for TRIM28 in healthy donors (n = 18) and SLE patients (n = 99). Mann–Whitney t test was performed to calculate significance. ****, P < 0.0001. (B) Linear regression analysis on correlation between normalized read counts for ERV-K102, K115, K106, K110, and TRIM28. r, Pearson r. (C) Differential expression of the indicated epigenetic repressor genes between healthy donors and SLE patients grouped by repressor complexes. log2FC, log2 fold change of gene expression in SLE compared with healthy. Statistical significance (adjusted P value [padj]) calculated by DESeq2. Heatmap of correlation between ERV-K and indicated genes showing Spearman r values (1 to −1) for significant correlations (P < 0.05). White grids, no significant correlation. (D) Percent of genes within each cluster that are significantly different between healthy donors and SLE patients (DESeq2, padj < 0.05). (E) Percentage of genes that significantly correlate with ERV-K loci (Spearman correlation, P < 0.05).

