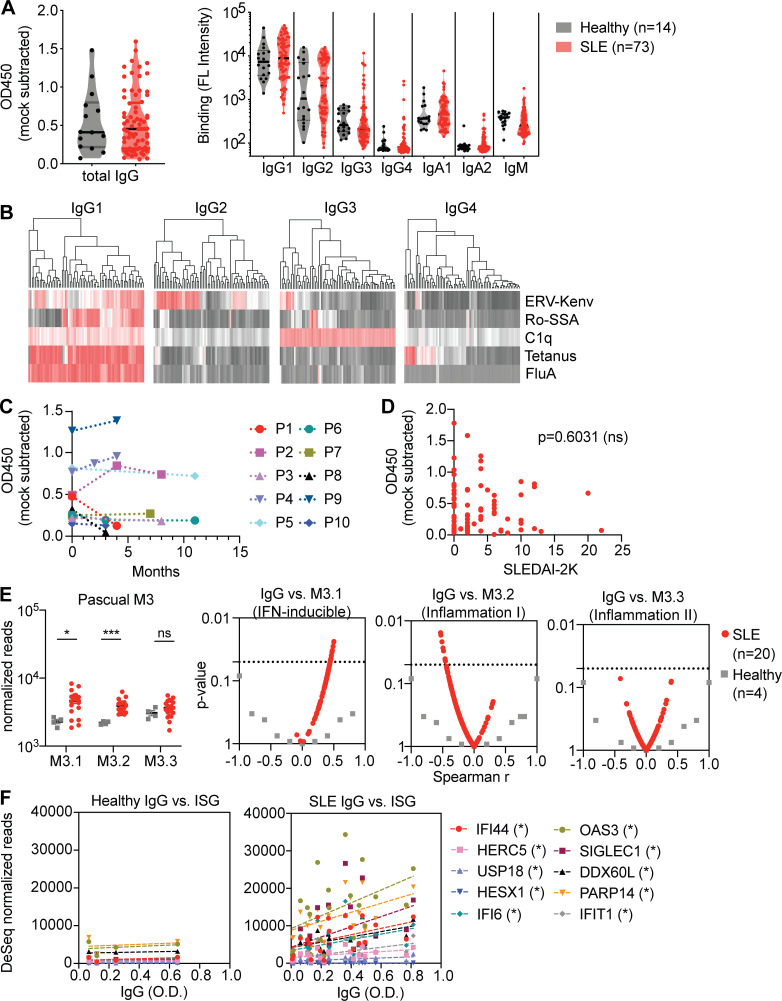
Figure 4.
Neutrophil activation by SLE IgG in an immune complex with ERV-K102 envelope protein. (A) Total IgG against recombinant ERV-K102 envelope SU measured by ELISA and IgG subclasses measured by Luminex assay in healthy (n = 14) and SLE (n = 73) plasma. (B) Hierarchical clustering of IgG levels in SLE patients for the indicated antigens and IgG subclasses measured by Luminex assay. FL, fluorescence. (C) Total anti-ERV-K102 IgG levels in SLE patients over the indicated months. Each line represents an individual patient (P; n = 10). (D) Correlation between anti-ERV-K102 IgG levels as measured by ELISA and SLEDAI-2K score obtained at the time of blood collection for SLE patients (n = 79). Spearman correlation analysis was performed. (E) Comparison of read counts for genes within M3.1, 3.2, and 3.3 modules between healthy (n = 4) and SLE (n = 20). Mann–Whitney t test was performed to calculate significance (*, P < 0.05; ***, P < 0.001). Volcano plot of Spearman r values obtained from correlation analysis between anti-ERV-K102 IgG levels and total read counts for genes in the indicated modules. Each dot represents an individual and dotted line is at P = 0.05. (F) Spearman correlation between read counts for the indicated genes versus total anti-ERV-K102 IgG levels measured by ELISA. *, P < 0.05.

