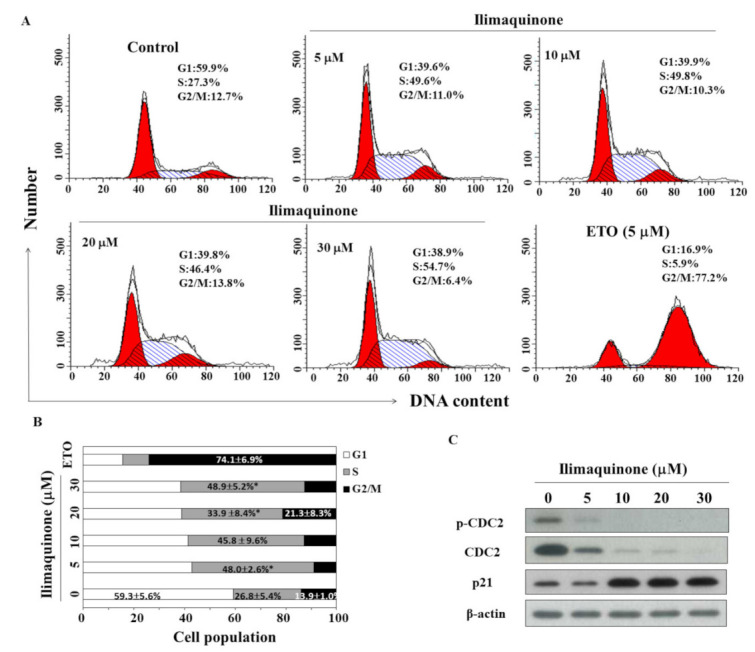
Figure 2.

Effects of ilimaquinone on cell cycle and cell cycle-related proteins in MCF-7 cells. (A) Flow cytometric analysis of the effect of ilimaquinone for 48 h in MCF-7 cells. (B) The percentage of cells in each cell cycle phase was determined by PI staining and analyzed by flow cytometry. Values are means ± S.D. of three independent experiments. * p < 0.05 compared with the control group. (C) Western blot analysis of the phosphorylation/expression of CDC2 and p21 after the treatment of ilimaquinone for 48 h in MCF-7 cells.
