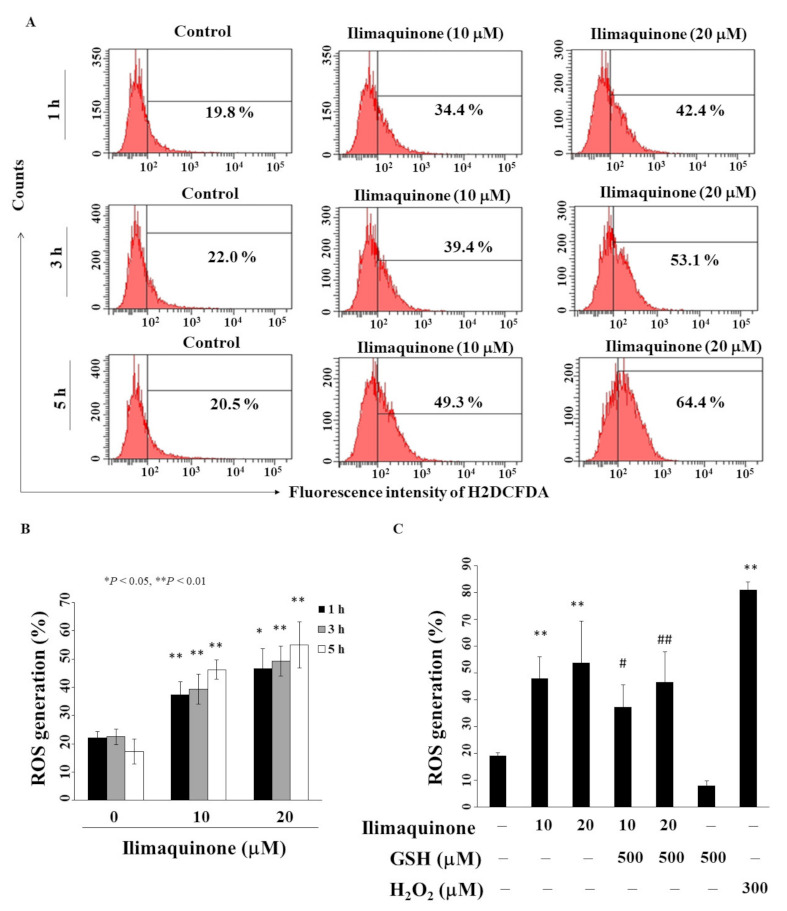
Figure 5.

Ilimaquinone increases ROS generation in MCF-7 cells. (A) Cells were treated with DMSO or ilimaquinone at 1, 3, and 5 h. (B) Histogram of ROS production of ilimaquinone at the indicated time interval in MCF-7 cells. Columns represent means; bars represent S.D. * p < 0.05, ** p < 0.01 compared with the control group. (C) Statistical analysis of ROS generation after the treatment of ilimaquinone alone or in the combination of 500 μM glutathione (GSH) or 300 μM H2O2 alone for 3 h (n = 5). Data are represented as means ± S.D. ** p < 0.01 compared with the control group. # denotes p < 0.05 when compared with ilimaquinone (10 μM) alone group. ## denotes p < 0.05 when compared with ilimaquinone (20 μM) alone group.
