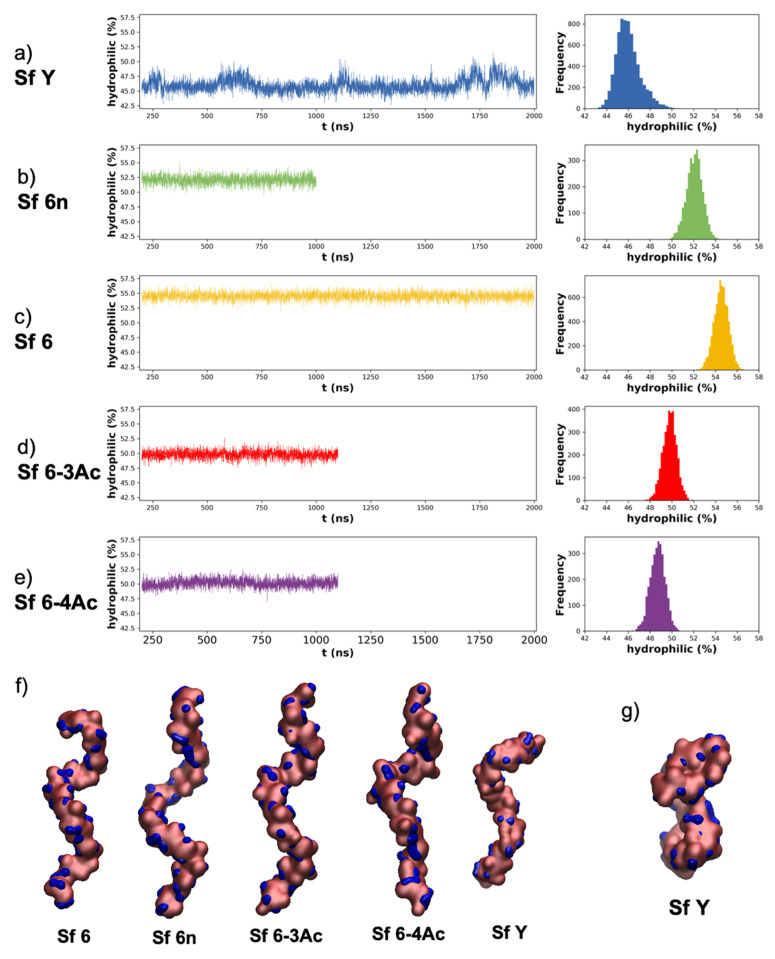
Figure 4.
Time series and histogram plots of relative % hydrophilic surface area for O-Ags: (a) Sf Y, (b) Sf 6n, (c) Sf 6, (d) Sf 6-3Ac, (e) Sf 6-4Ac. VMD Quicksurf representation of the hydrophilic (blue) and combined neutral/hydrophobic (pink) surfaces of the O-antigens are shown in (f) ordered from highest (Sf 6) to lowest (Sf Y) % hydrophilic surface. (g) VMD Quicksurf representation of a collapsed Sf Y conformation from around. Note that for Sf Y and Sf 6, longer simulation times were required to reach convergence (both 2000 ns) than for Sf 6n (1000 ns), Sf 6-3Ac (1100 ns), and Sf 6-4Ac (1100 ns).

