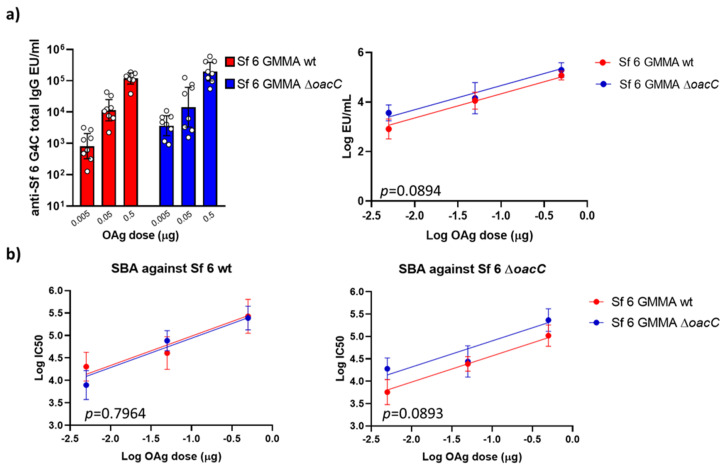
Figure 6.
Immunogenicity in mice of S. flexneri 6 (Sf) GMMA differing in O-Ag O-acetylation on RhaIII. Eight CD1 mice per group were immunized intraperitoneally with three doses of O-Ag (0.005, 0.05, 0.5 μg). S. flexneri 6 Group 4 Capsule (G4C), encompassing the same RU of the O-Ag, was used as the ELISA coating antigen. (a) Summary graph of anti-G4C specific IgG geometric mean units (bars) and individual antibody levels (dots) on the left; statistical comparison of the resulting dose response curves on the right; (b) Summary graphs of SBA IC50 titers against S. flexneri 6 wild type (on the left) and ΔoacC (on the right) strains. ELISA and SBA data were analyzed using the parallel line approach. Each curve represents log-transformed doses on the abscissa and the log-transformed ELISA units or SBA titers on the ordinate. The parallelism of the lines was tested by comparison of the slopes, which resulted in no significant differences. Subsequently, the Y-intercept of the curves were compared, and the p-values are reported in the graphs.

