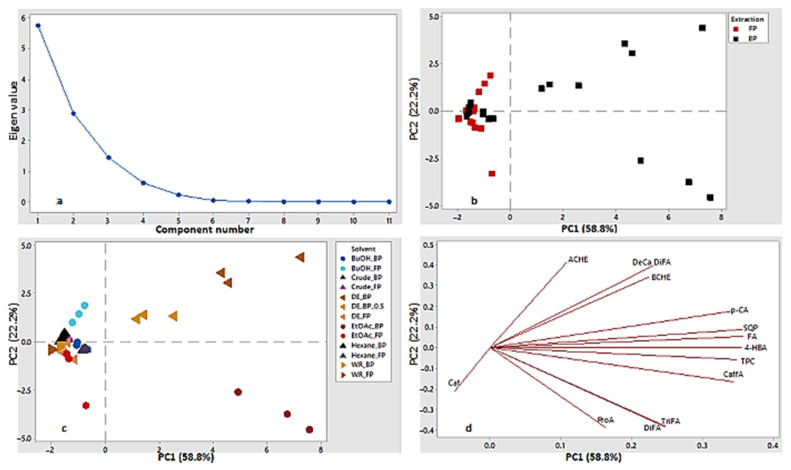
Figure 2.
(a) Scree plot of BSG FP and BP extracts and fractions; (b) Score plot for the first two components (PC) separated by the type of extractions FP and BP; (c) score plot for the first two components separated by the type of organic solvent used for fractionation of the FP and BP extracts; (d) loading plot of the first two components.

