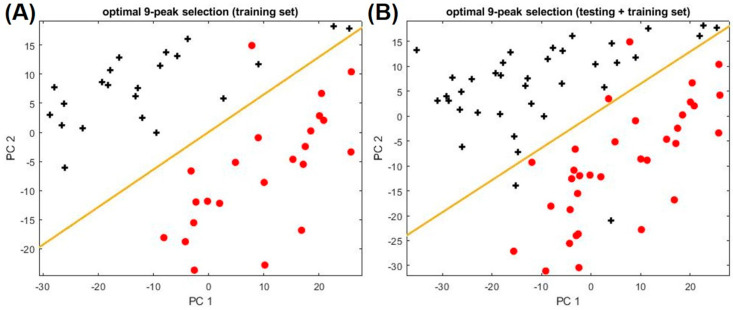
Figure 2.
PCA plots using the optimal 9-peak subset (9 biomarkers) for distinguishing asthma from non-asthma/non-atopic subjects. (A) Training set. (B) Training set plus testing set. Asthma and non-asthma/non-atopic are denoted as red circles and black crosses, respectively. The yellow line marks the position of the boundary. The peak IDs and their chemical names of the nine biomarkers can be found in Table 2.

