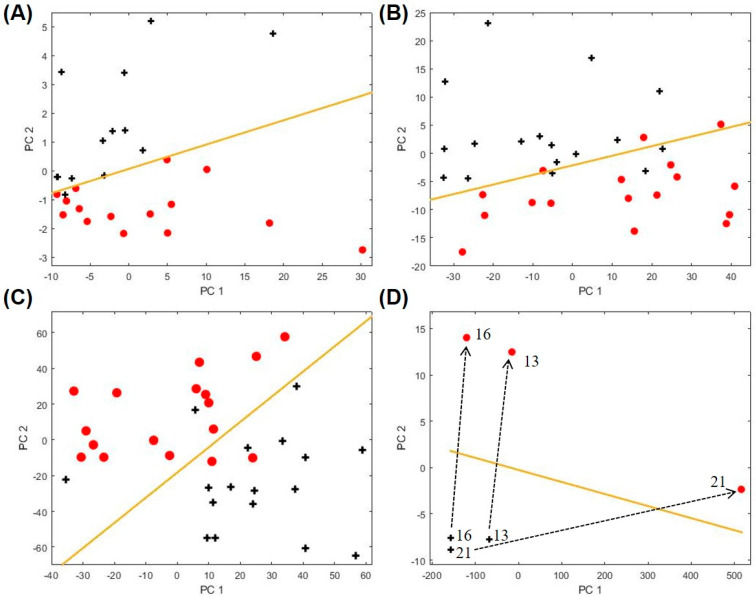
Figure 4.
PCA plots for biomarkers of clinically relevant asthma characteristics (A) inhaled corticosteroid (ICS) treatment, (B) obesity, (C) blood eosinophils (EOS) level, and (D) upper respiratory illness. The red symbols denote data for the positive groups, i.e., asthma subjects on ICS treatment, obesity (BMI ≥ 30), high EOS level (blood EOS ≥ 0.3), and upper respiratory illness. The black symbols denote the corresponding negative controls, i.e., asthma subjects not on ICS treatment, BMI < 30, low EOS (blood EOS < 0.3), or absent acute upper respiratory illness (baseline sample). The boundary lines are marked in yellow. The corresponding biomarkers are listed in Table 1 and Table 2. The dashed lines show the trajectories in the longitudinal analysis for three asthma patients who later developed upper respiratory illness. The subject IDs are given by the numbers near the crosses. The PCA plot for both training and testing sets for ICS treatment is given in Figure S8.

