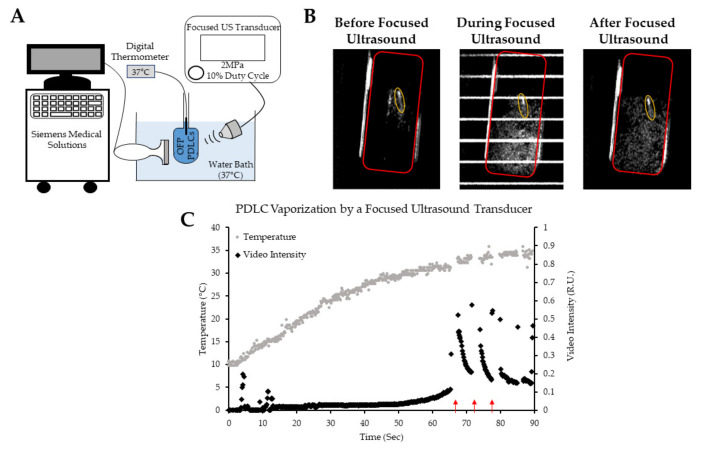
Figure 9.
Visualizing focused ultrasound-induced octafluoropropane droplet vaporization using a clinical scanner. (A) Schematic of the setup used for acquiring B-mode images to monitor OFP droplet vaporization. (B) B-mode images showing the vaporization of OFP droplets before, during, and after focused ultrasound application. The region of interests (ROIs) used for intensity quantifications are shown. The temperature probe inside of the tube can be seen in the B-mode images and is shown by the yellow ellipse. (C) Video intensity within the chamber (ROIs showed in red). The red arrows show sonication starting points.

