
Figure 2. League Plot of the Network Estimates for Core Body Temperature at Admission or Within 2 Hours of Life.
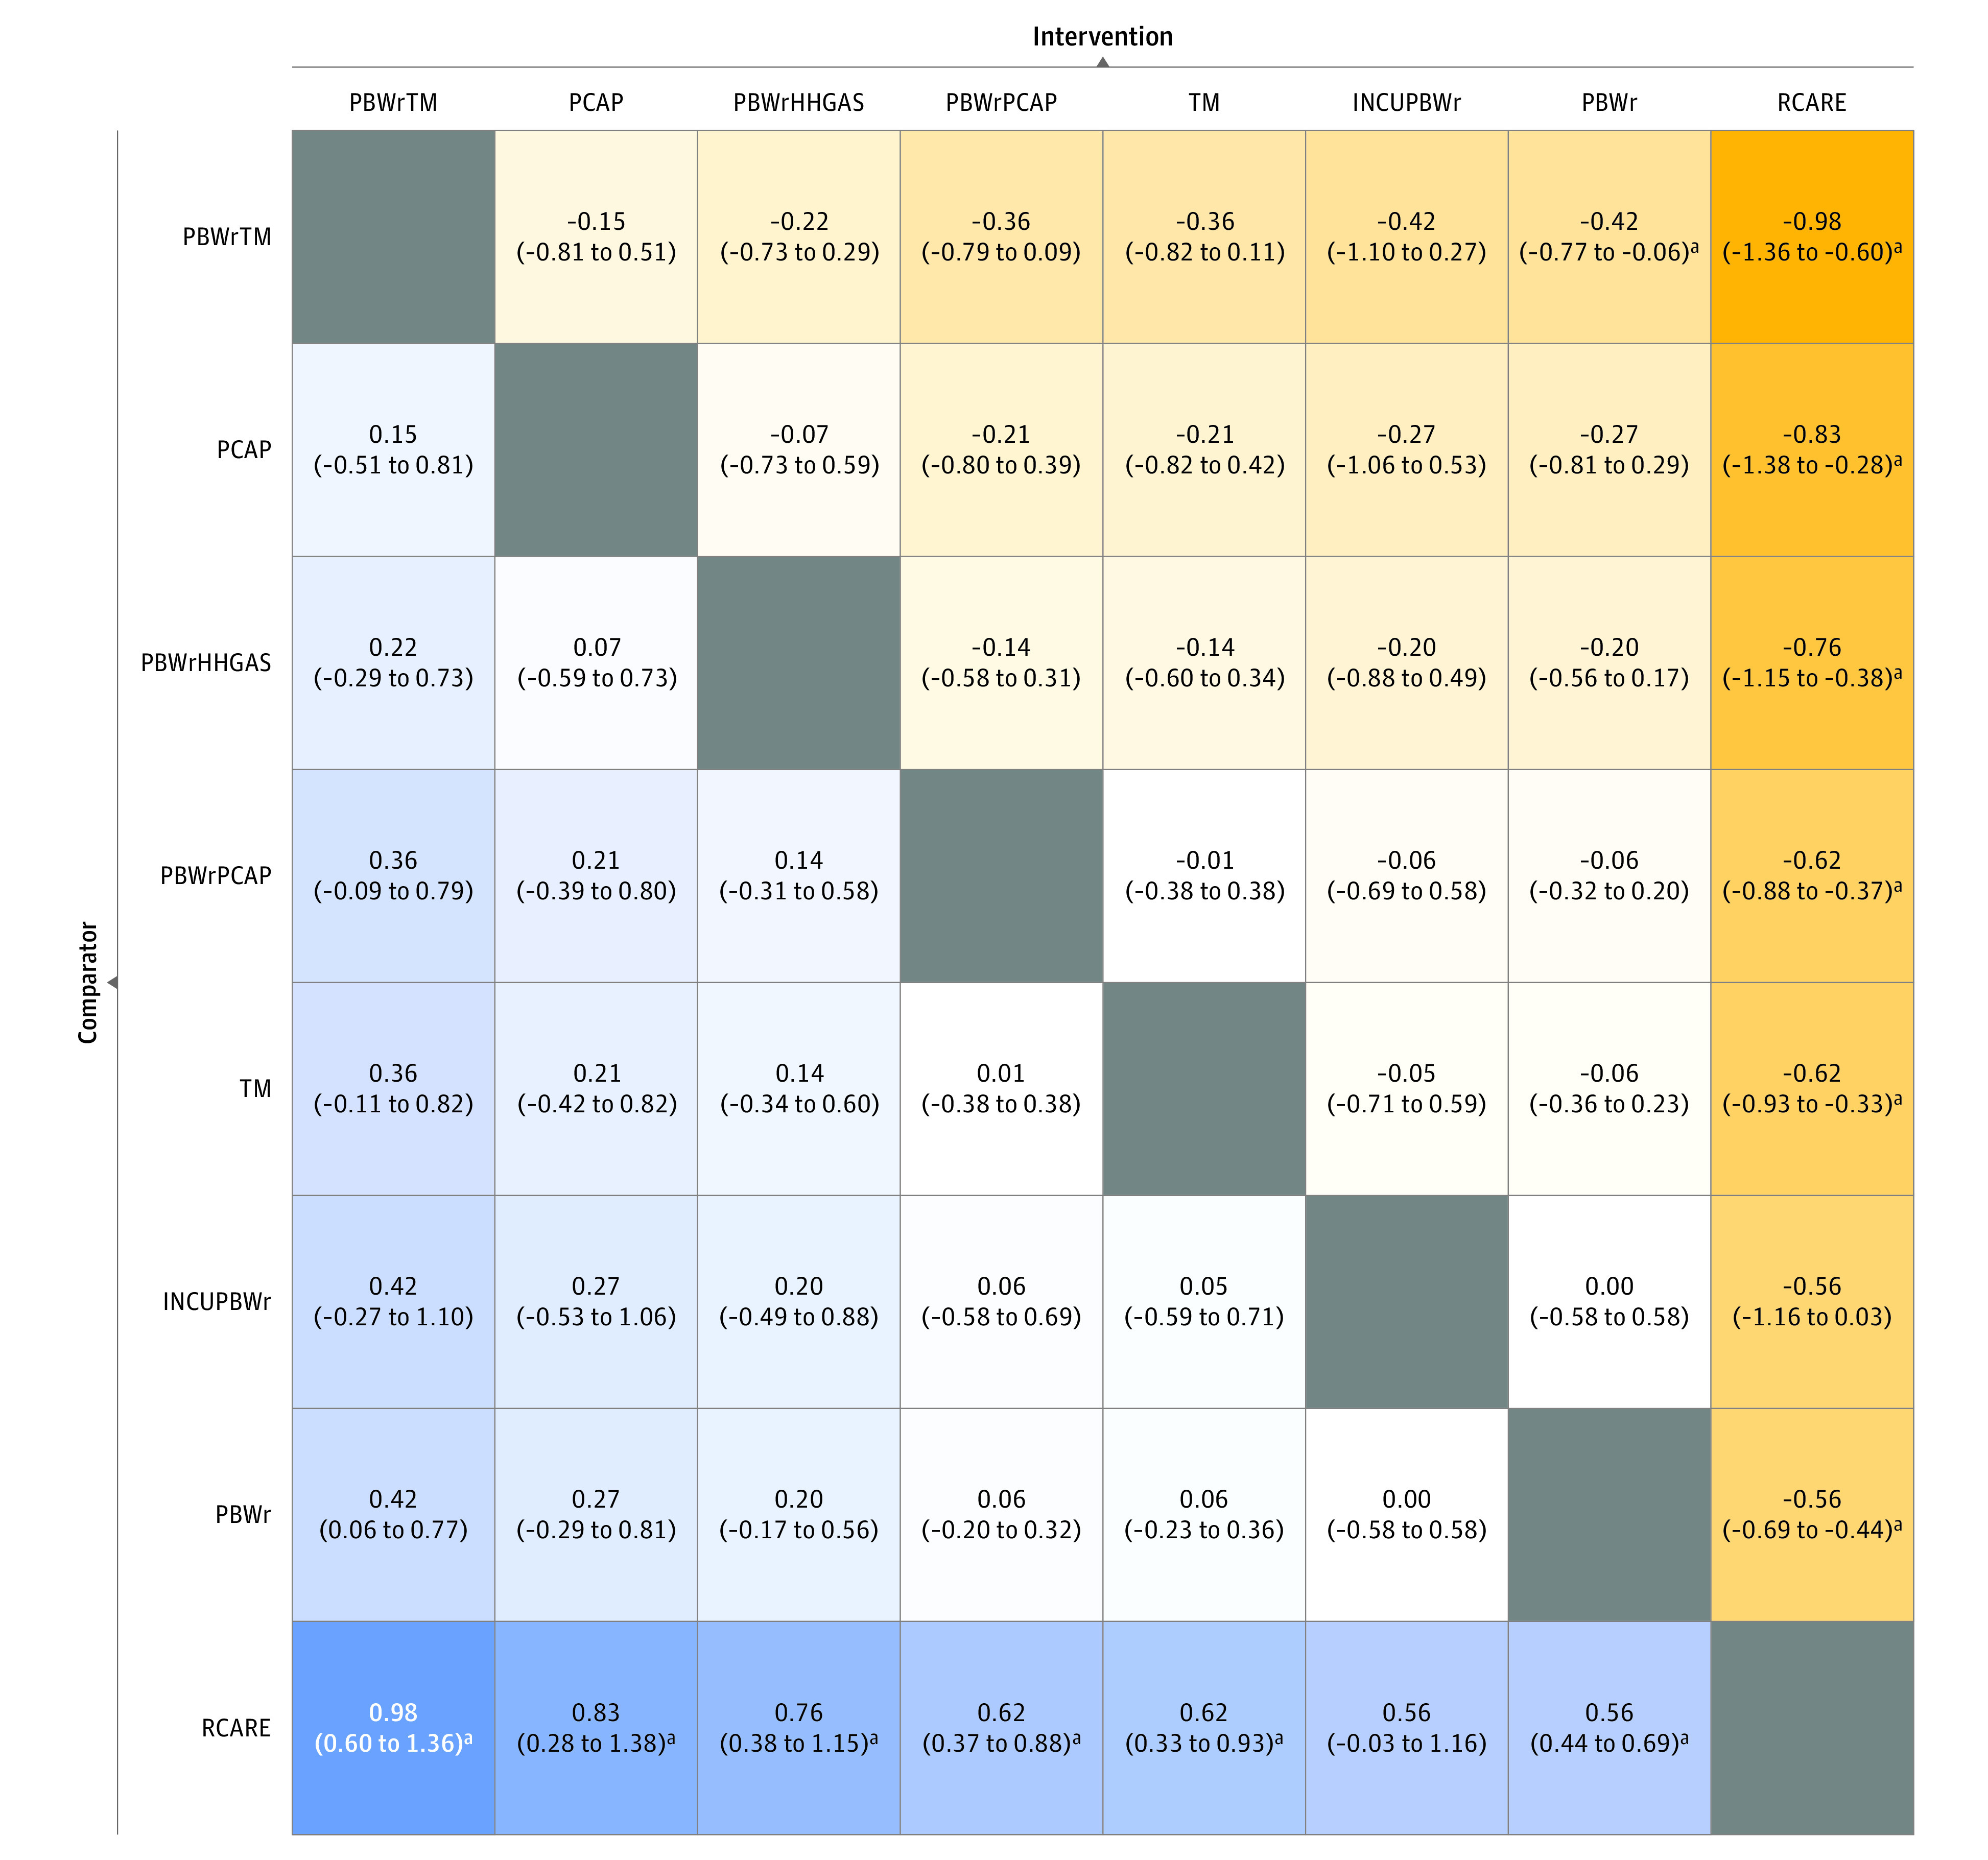
League plots compare the effect estimate for an intervention in the column with an intervention in a row. Network estimates are depicted as risk ratio (RR) with 95% credible interval (CrI). INCUPBWr indicates plastic bag or wrap with incubator transport; PBWr, plastic bag or wrap; PBWrHHGAS, plastic bag or wrap with heated humidified respiratory gases; PBWrPCAP, plastic bag or wrap with plastic cap; PBWrTM, plastic bag or wrap with thermal mattress; PCAP, plastic cap; RCARE, routine care; and TM, thermal mattress.
aRR is statistically significant.