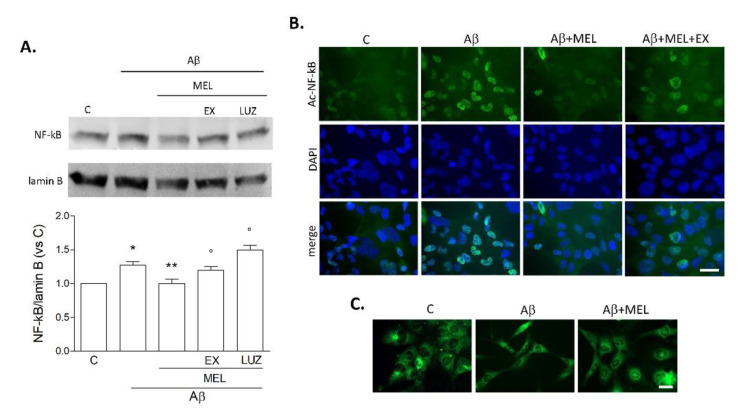
Figure 6.
Pro-inflammatory switch of HMC3 cells upon prolonged Aβ42 exposure. Cells were treated for 72 h with Aβ42 alone (0.2 μM), in combination with melatonin (MEL, 1 μM), MEL+EX527 (EX; 5 μM), or MEL+luzindole (LUZ; 25 μM). In (A), Western blot of NF-kB p65 on nuclear fractions. Results are the mean ± SEM of three independent experiments, and a representative blot is shown. * p < 0.05 vs. C, ** p <0.05 vs. Aβ, ° p < 0.05 vs. Aβ+MEL by one-way ANOVA followed by Newman–Keuls test for significance. In (B), representative images of immunostaining for acetyl-Lys310-NF-kB p65 (green) with DAPI counterstaining (blue; scale bar = 40 μm). In (C), morphological appearance of cells stained with fluorescent dye FM 1–43 (5 μM for 15 min; scale bar = 50 μm).

