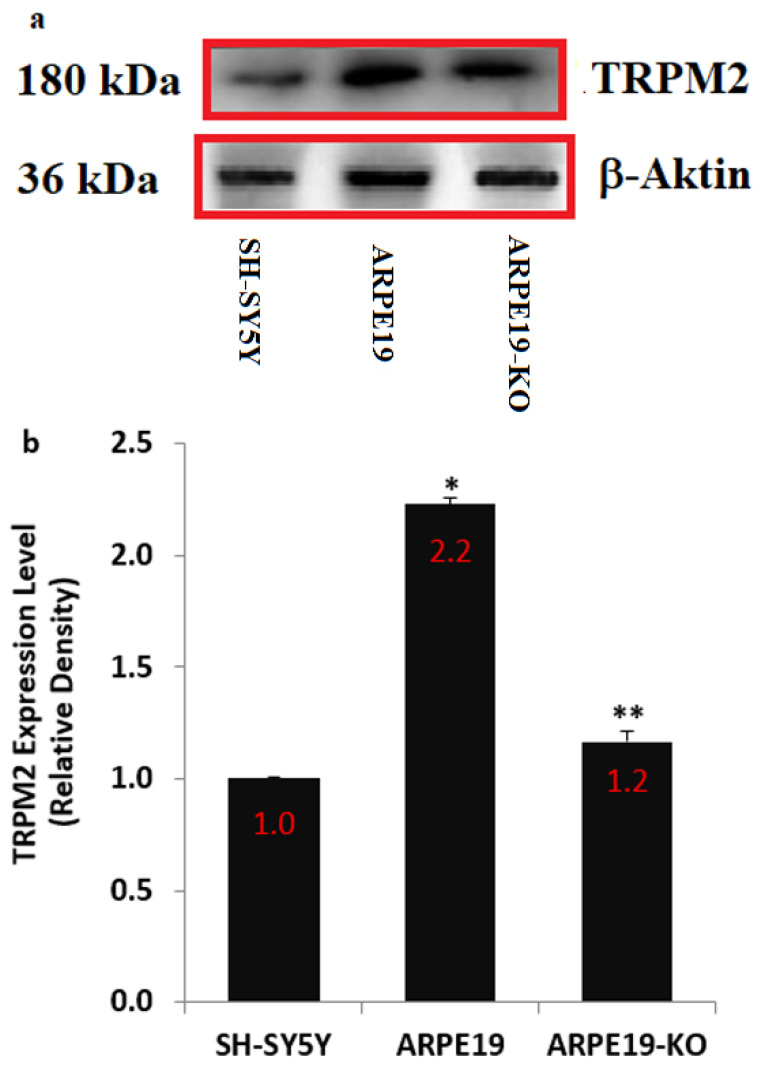
Figure 1.
The expression level of TRPM2 protein. (Mean ± SD and n = 3). For the expression levels of TRPM2 protein in the cells of SH-SY5Y, ARPE19 and ARPE19-KO, we used standard Western blot analyses. The protein bands of β-actin were used as control. (a) The protein bands of β-actin and TRPM2. (b) The mean levels of the band proteins in the column figure were expressed as Mean ± SD. 1:500. (* p ≤ 0.05 vs. SH-SY5Y cells. ** p ≤ 0.05 vs. ARPE19 cells).

