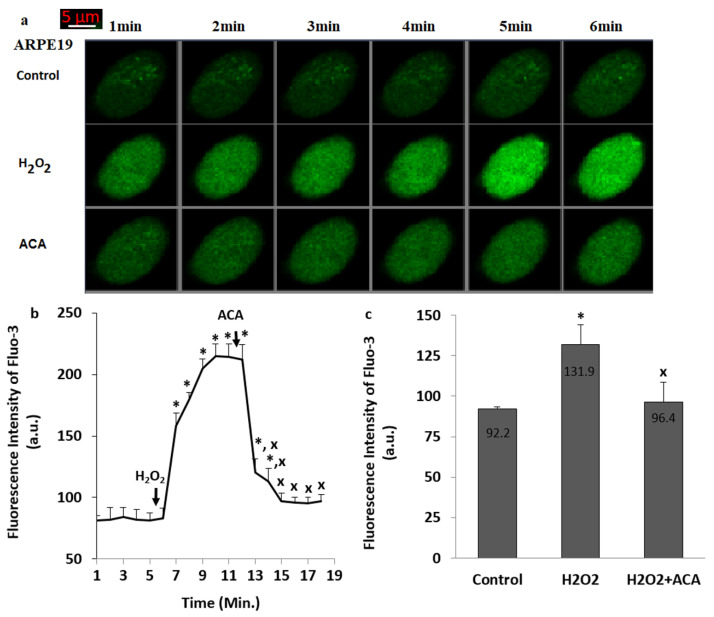
Figure 2.
The H2O2 -mediated upregulation of Ca2+ fluorescence intensity through the stimulation of TRPM2 in the ARPE19. (n = 25–30). After incubating the ARPE19 cells with Fluo-3AM (1 µM for 60 min), the TRPM2 stimulator (H2O2 and 1 mM) and blocker (ACA and 25 µM for 6 min) applied to the cells within three groups (control, H2O2 and H2O2 + ACA). The cells were analyzed. The fluorescence intensity of Fluo-3AM in the ARPE19 was imaged at 515 nm in the LSM 800 laser scan microscope with 40 × 1.3 oil objective and the results were indicated as arbitrary unit (a.u.). (a) Imagines of the Fluo-3AM. (b,c) The mean fluorescence intensity of Ca2+ in the column and line figures were expressed as Mean ± SD in the ARPE19 after the treatments of H2O2 and ACA. (* p ≤ 0.05 vs. control. x p ≤ 0.05 vs. H2O2 group).

