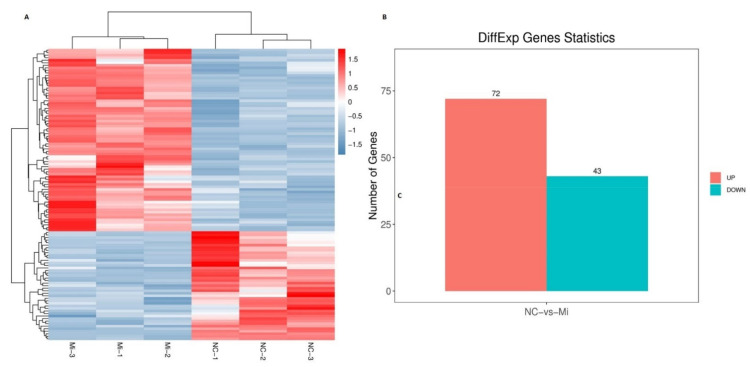
Figure 4.
Quantification of DEGs in differentiated bovine adipocytes transfected with bta-miR-149-5p mimic and mimic NC. (A) The heatmap gene expression chart for the hierarchical cluster analysis of DEGs between 2 different groups of adipocytes transfected with bta-miR-149-5p mimic (n = 3) and mimic NC (n = 3). (B) The bar graph represents the number of DEGs between the 2 groups of differentiated bovine adipocytes transfected with bta-miR-149-5p mimic (n = 3) and mimic NC (n = 3). The red shows the number of upregulated genes and blue represents the number of downregulated genes.

