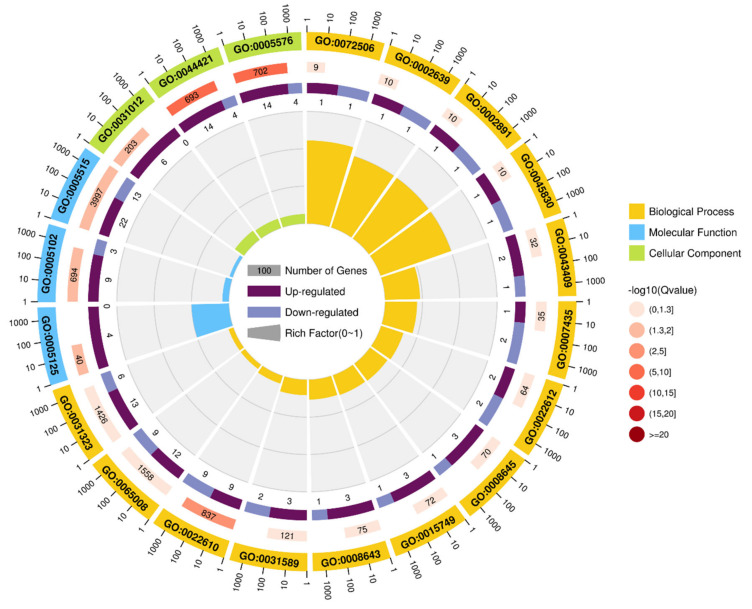
Figure 6.
The Gene Ontology (GO) classification of DEGs in 2 groups of bovine adipocytes, transfected with bta-miR-149-5p (n = 3) mimics and mimics NC (n = 3). Each category of GO term was represented with different colors: yellow reflects biological process, green shows cellular component, and blue depicts molecular function.

