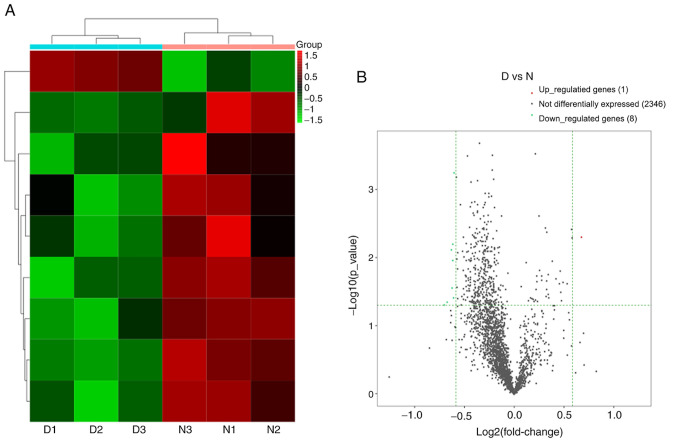
Figure 8.
Changes in the lncRNA expression profiles in the spinal cord of the DNP mice. (A) Heat map of the lncRNAs with hierarchical clustering of the DE mRNAs between the mice in the D and N groups. In the clustering analysis, up- and downregulated genes are colored in red and blue, respectively. (B) Volcano plot displaying the up- and downregulated lncRNAs between the D and N groups. D, diabetic; N, normal control; DNP, diabetic neuropathy; lncRNA, long non-coding RNA.

