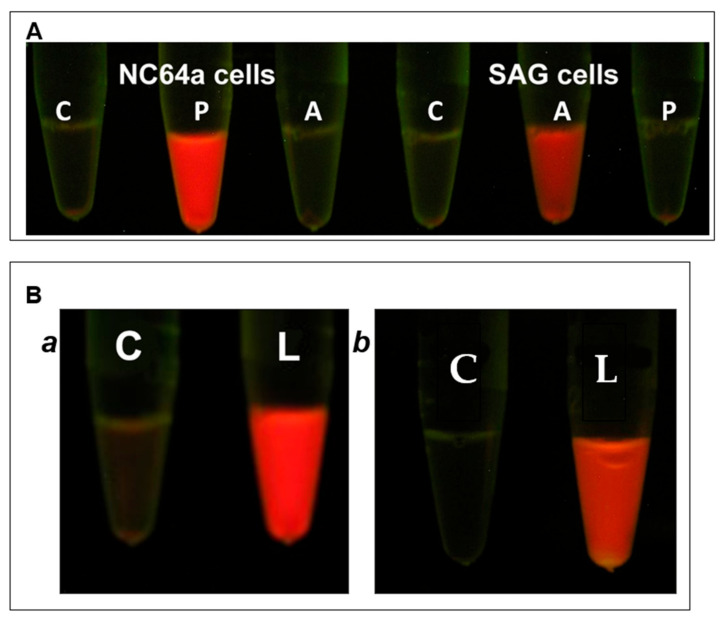
Figure 2.
Specificity of the reaction of chlorella cells to virus infection and to virion associated cell wall degrading activity. (A). Exposure of chlorella host cells to chloroviruses PBCV-1 and ATCV-1. From left to right: (C) control (intact C. variabilis NC64A cells treated with 1% SDS), (P) C. variabilis NC64A cells plus intact PBCV-1, (A) C. variabilis NC64A cells plus intact ATCV-1 virus, (C) control (intact C. heliozoae SAG cells treated with 1% SDS), (A) C. heliozoae SAG cells plus intact ATCV-1 virus, (P) C. heliozoae SAG cells plus intact PBCV-1 virus. Cells (concentration 2 × 10⁷) were infected with viruses at a MOI of 5 incubated for 15 min and SDS was added to 1%. (Note: One obtains the same results if one uses Triton X-100 at the same concentration.) Note the specificity of chlorovirus infection. (B). Exposure of chlorella host cells to PBCV-1 vLysin: Panel a: C. variabilis NC64A cells, Panel b: C. heliozoae SAG cells. (C) Control (intact cells treated with 1% SDS), (L) cells incubated with PBCV-1 vLysin. Cells (concentration 2 × 10⁷) were treated with activity equivalent to 5 × 10¹⁰ PFU/mL for 15 min followed by addition of SDS. Note that the PBCV-1 vLysin treatment resulted in the release of chlorophyll from both types of cells. Images were taken under UV light to evaluate the autofluorescence of chlorophyll (red).

