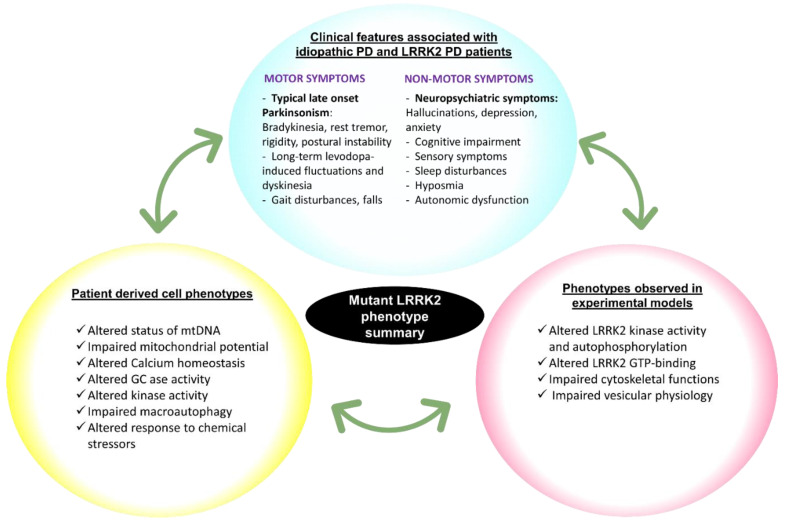
Figure 2.
Diagrammatic representation of the summary of the mutant LRRK2 phenotypes observed in PD patients, patient-derived cells, and in experimental models. The diagram first summarizes the present review to describe the phenotypes of mutant LRRK2 in the three areas (given as three bubbles) of the clinic, patient-derived cells, and experimental models. Each bubble highlights the main phenotypic observations for that area. Please refer to the text for a detailed mutant per mutant description of the different phenotypes. Please also refer to Table 1 for a detailed inventory of the patient-derived cell phenotypes described in literature.

