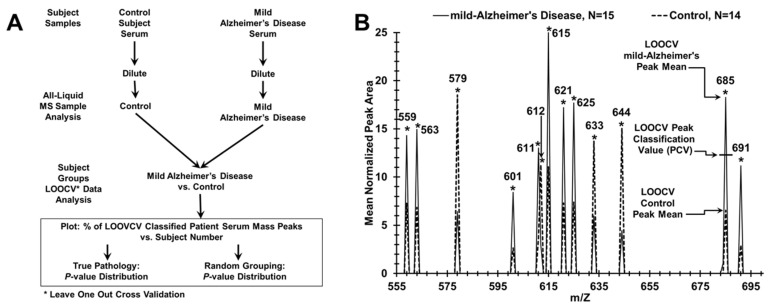
Figure 1.
Analytical procedures involving LOOCV/PCV for distinguishing AD patient and control groups using a MS serum profiling platform. (A) Flow chart for serum sample handling and mass spectrometry for binary AD patient/subject group analysis. (B) Serum mass peak Scoring for LOOCV/PCV (leave [one serum sample] out cross validation/peak classification value) procedure to classify mass peaks as either “mild AD” or control from a “left out” sample, over a narrow range (555–695 m/z is displayed) of significant group discriminatory mass peaks. The PCV example is exhibited on peak 685 which is used to classify “left out” peaks as either “mild AD” (peak area above this PCV) or control (peak area at or below this PCV).

