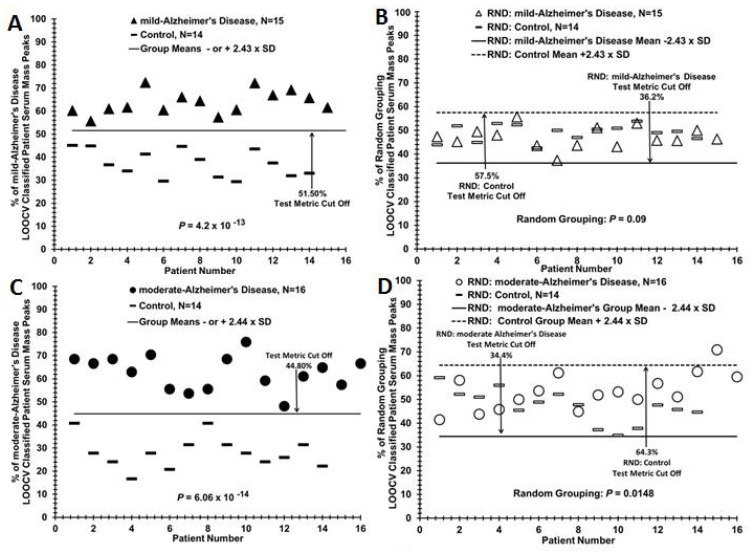
Figure 2.
Distinguishing sera of mild or moderate AD patients from control individuals by MS serum mass profiling (A) Serum discrimination of mild AD patients (dark triangles) from controls (dashes) by % of LOOCV/PCV classified mass peaks. A cut off value is present (− or + SDs from the mild AD or control groups, respectively) to determine test metric values (e.g., true positives). (B) Non-serum sample discrimination when the two different sample groups in A are mixed together randomly followed by the same LOOCV/PCV mass peak analysis. (C) Serum discrimination of moderate AD patients (dark circles) from controls (dashes). (D) Non-serum discrimination upon randomization of sera samples between the two groups in C followed by the same LOOCV/PCV analysis.

