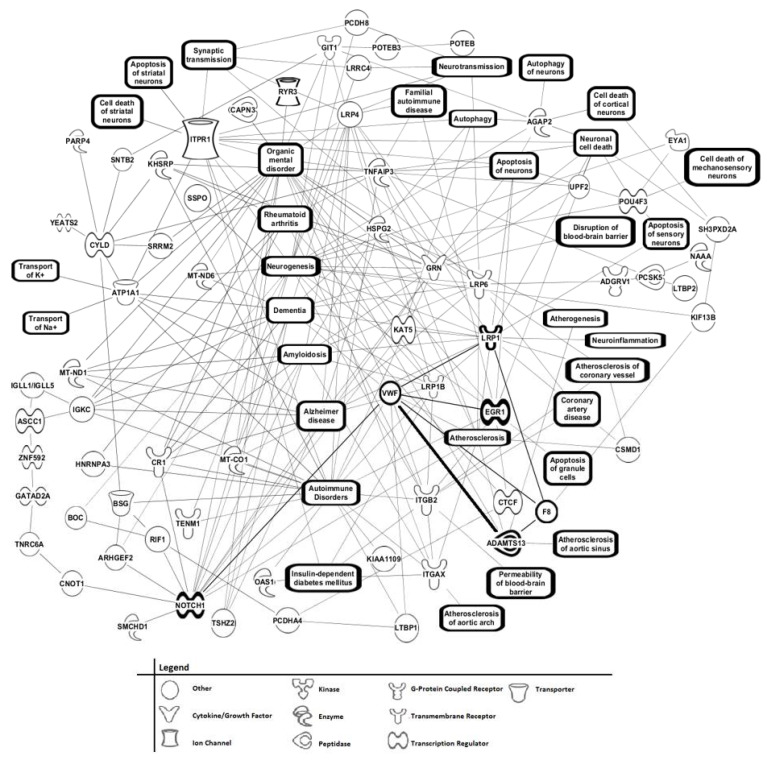
Figure 7.
IPA of m/z “range” MS/MS serum data from mild AD patients vs. control subject comparison using top 119 peptides/proteins from Table 3 and Table 4. IPA m/z range MS/MS serum data analysis for mild AD patients vs. controls using top 119 peptide/proteins from Table 3 and Table 4. Ingenuity Pathway Analysis (IPA), Qiagen, Inc.) of the 119 peptides/proteins exhibited in Table 3 and Table 4 having a 2x difference in positive sera number between mild AD patients and controls, and a 1.5x difference in MS/MS “hit” [single-peptide identification] ratio between the two groups. The protein function symbol legend is at the bottom of the figure.

