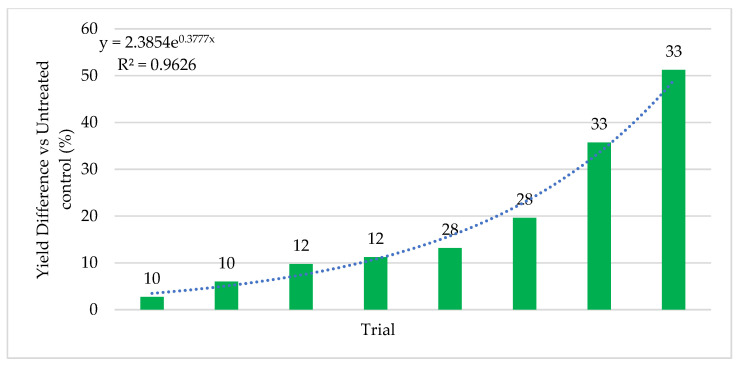
Figure 7.
Cotton Percent Yield Difference vs Stress. Stress increases left to right from 10–33 with level of stress indicated above each bar as described in the materials and methods. Higher stress levels are indicated by higher numbers. Trials were performed in TX, Australia, and India using four commercial hybrids with Standard PPP’s. Each bar is a separate trial and plots sizes varied from 10 ft × 50 ft to 50 acres. The bars indicate the percent difference in yields of ThMS3a treated versus the untreated control. With increasing stress, increases in yields were observed. Each test had a single replication of treated and untreated so it was not possible to include standard deviations or statistical analysis. Cooperators: CRO’s, seed companies and farmers.

