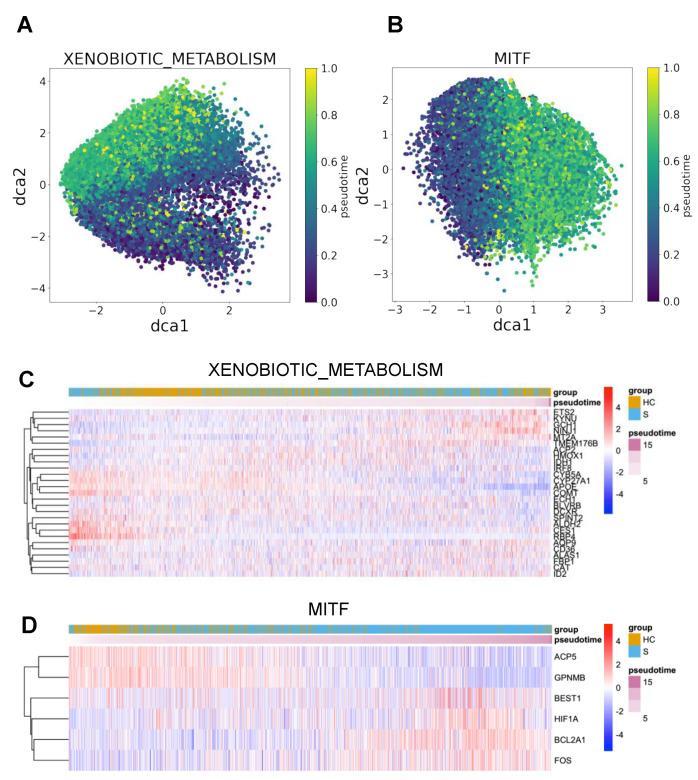
Figure 4.
Visualization of both manifold and gene expression change of top transcriptional programs of the severe trajectory in macrophages. (A,B) A cell manifold of xenobiotic metabolism pathway and MITF transcription factor performed by DCA, respectively. X- and y-axes indicate the first and second dimensions of the gene manifold. Each point indicates a cell and is colored by its pseudotime. (C,D) Gene expression heatmaps for the top transcriptional programs (xenobiotic metabolism pathway and MITF). The transcriptional program genes expressed in less than 20% of cells, or the cells showing less than 40% of expressions of the transcriptional program’s genes were excluded during the heatmap visualization.

