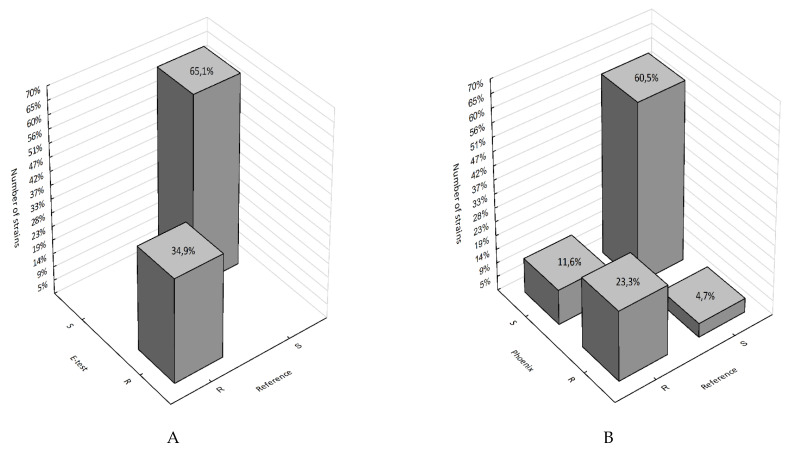
Figure 7.
3D histograms of correlations between the number of fosfomycin-susceptible and fosfomycin-resistant strains determined by the E-test, Phoenix, and the reference method; (A) reference method vs. E-test; (B) reference vs. Phoenix; R—strain resistant to fosfomycin; S—strain susceptible to fosfomycin.

