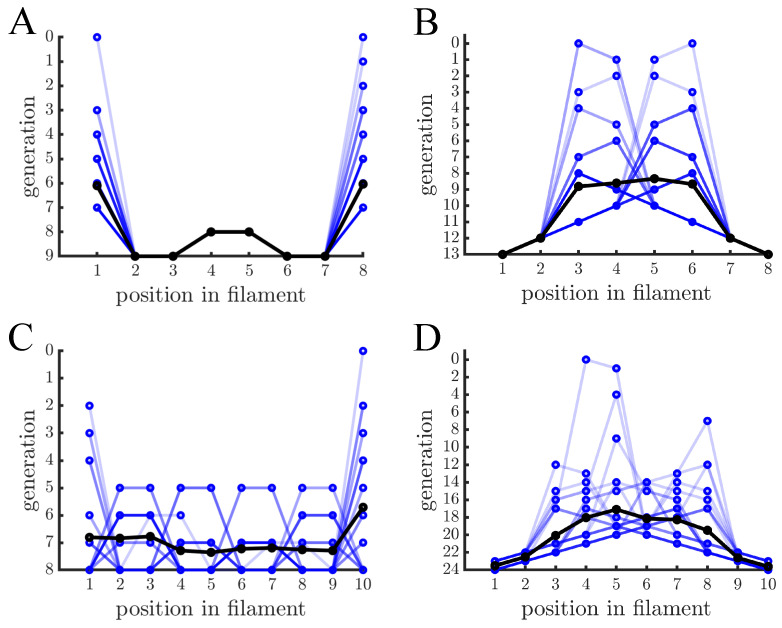
Figure 2.
Age distribution within multicellular filaments. (A) The age of cells within multicellular filaments is shown as a function of cell position. Cells reproduce via binary fission and filaments reproduce once they reach 8 cells— different blue lines indicate different multicellular filaments and black lines indicate the population mean. A cell’s age corresponds to the generation that its oldest pole was created. In this case the oldest cells are at the ends of the filament and the next oldest cells are in the middle. (B) The graph is similar in structure to (A) except cells reproduce via budding so cell age is the generation in which the cell was created. Contrary to binary fission, the ends of the filaments contain the youngest cells and the older cells are in the middle. (C,D) The graphs are similar to (A,B), respectively, except that multicellular filaments reproduce at 10 cells. Budding has the same basic age structure but binary fission has a less regular pattern because not every cell has reproduced (i.e., filament size is not a power of 2).

