Figure 3.
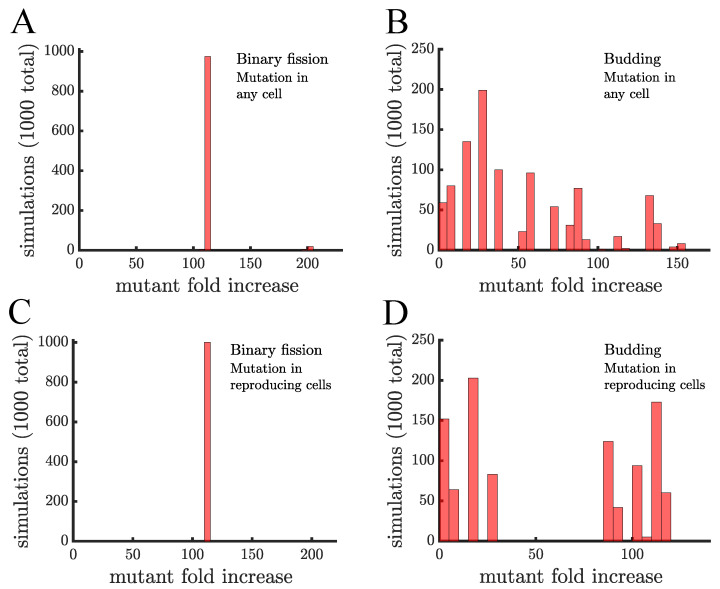
The spread of a fast-growing mutant without age-related fitness costs. (A) A histogram shows the fold increase of the mutant fraction (, where the initial fraction is ) for independent simulations of a population reproducing via binary fission. In this panel the mutation is introduced in a random cell from the entire population regardless of when it reproduces. There is almost no dispersion in the histogram because at the point the mutation is introduced every cell is identical. The only outlier bar comes from the case in which the mutation is introduced in a cell that is just about to reproduce, i.e., the mutation is introduced when the population reaches 1000 but by the end of that time step the population will be 1024. (B) This panel shows the same type of data as a) but for a population of cells reproducing via budding. Here, cell reproduction depends on location in the filament so at the point the mutant is introduced cells differ in terms of their next expected reproduction time. The histogram is much more dispersed and the majority of simulations (868) have a lower mutant fold increase than in populations reproducing via binary fission in (A). (C,D) These panels are similar to (A,B), respectively, except the mutant is introduced in cells that just reproduced. This has no effect on binary fission populations but in budding populations it produces a more bimodal distribution with 498 mutations having a fold increase >75 and 502 having a fold increase <30, depending on whether the mutation occurs in the daughter or parent cell, respectively.

