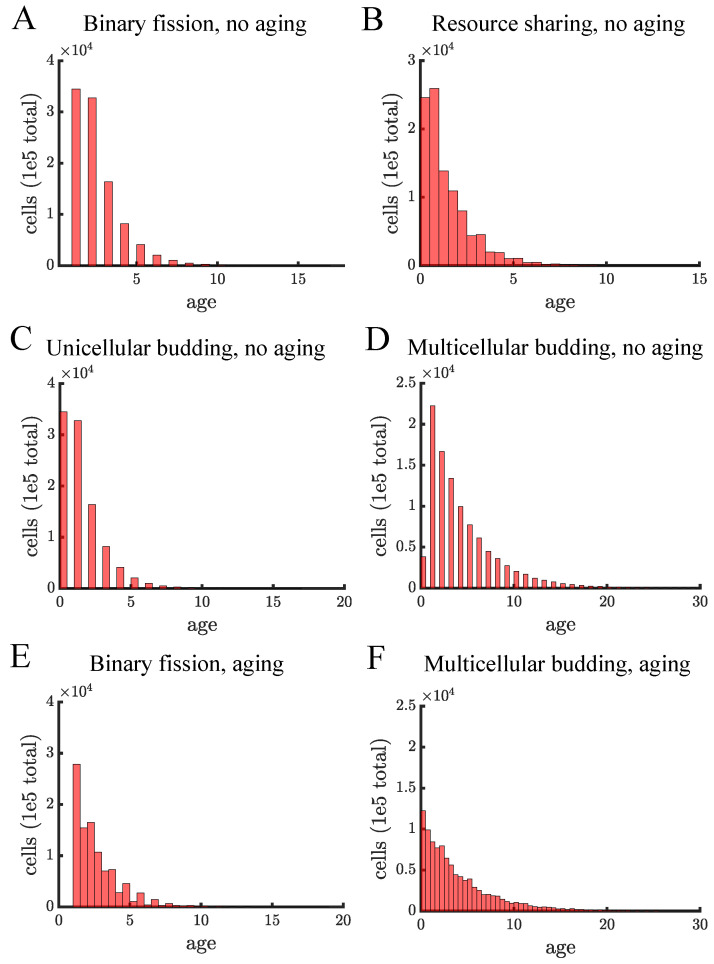
Figure A13.
Age structure for different populations. Each panel shows the distribution of cell ages in a population once it reaches carrying capacity. Each distribution is from a single simulation in which the only stochasticity comes in choosing the final cells to reproduce so that the population reaches carrying capacity exactly. (A) In our model there is no difference between unicellular and multicellular binary fission populations so their age distributions should be identical. Since age in binary fission populations is the age of the oldest pole, there are no cells with age 0. (B) The resource sharing population consists of budding multicellular filaments. The populations reaches carrying capacity at the same time as populations reproducing via binary fission and unicellular budding populations (17 time units). (C) The unicellular budding population has a similar age structure to resource sharing in B). (D) In multicellular budding without aging the population takes much longer to reach carrying capacity (41 time units) which causes the age distribution to be much broader. (E,F) These are similar populations as in (A,D), respectively, except there are growth-related costs of aging in terms of an aging factor of 1.05. In the absence of aging, cells reproduce synchronously so there are fewer possible distinct ages in comparison to populations with an aging factor—this explains why there are more bars in (E,F).

