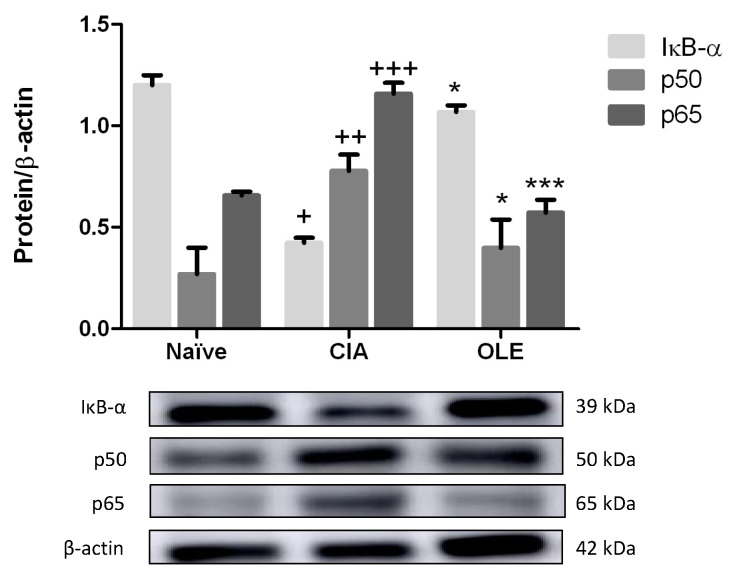
Figure 10.
OLE diet-enriched controlled NF-κB signaling pathway preventing IκB-α degradation and p65 and p50 subunits migration to the nucleus. The expression was quantified by densitometry analysis and normalized with respect to β-actin (house-keeping). Western blot images are representative of separate experiments with similar results. Naïve group, non-arthritic control animals fed with SD; CIA, control group induced arthritic animals fed with SD; OLE induced arthritic animals fed with OLE enriched diet (0.025% w/w). Values represented mean ± S.E.M. (n = 8), + p < 0.05; ++ p < 0.01; +++ p < 0.001 vs. Naïve group; * p < 0.05; *** p < 0.001 vs. CIA group.

