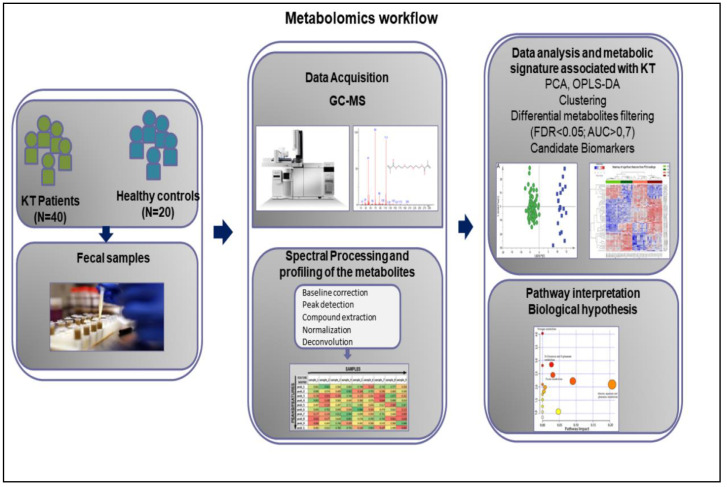
Figure 1.
Workflow of GC–MS-based metabolomics for metabolomic profiling and data interpretation of fecal samples from stable kidney transplants patients. KT: Kidney Transplant patients; N: Number of patients and healthy subjects; PCA; Principal component analysis; OPLS-DA: orthogonal partial least squares-discriminant analysis; FDR: False Discovery Rates; AUC: Area Under the Curve.

