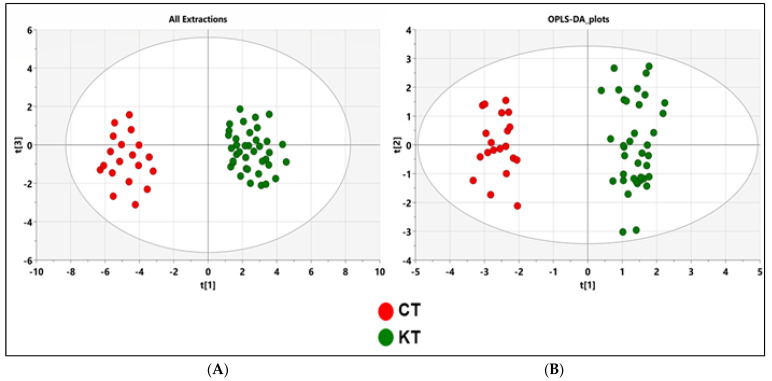
Figure 3.
PCA and OPLS-DA score plots of the fecal metabolic profiles from the KT and control (T) groups. An overview of the data from all the five extractions confirms that there are no outlying samples within a 95% confidence interval. (A) PCA scores plot model with R2X = 0.72 and Q2 = 0.54. Red circles represent healthy control samples, and green circles represent KT samples. (B) Orthogonal partial least squares discriminant analysis (OPLS-DA) scores plot model showing separation based on all extraction methods with R2(X) = 0.37, R2(Y) = 0.958, Q2 = 0.841, and cross validated analysis of variance (CV-ANOVA) p = 1.106 × 10⁻¹⁸ values. Red circles represent healthy control samples, and green circles represent KT samples. CT: Healthy subjects group; KT: Kidney transplant patients.

