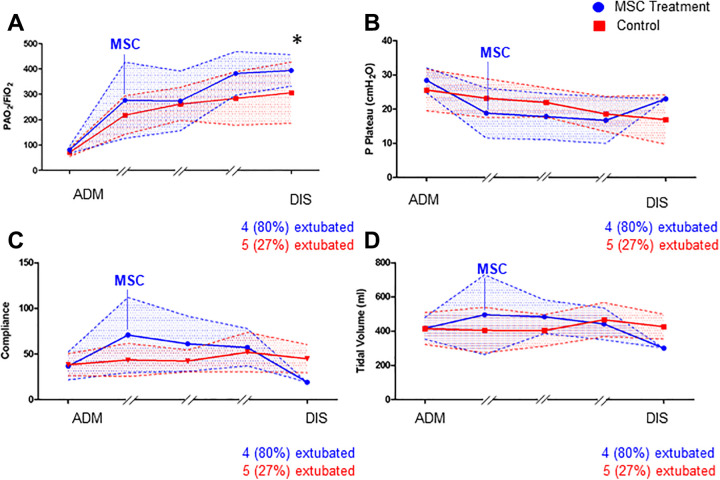
Figure 2.
Schematic graph of ventilation parameters during the intensive care unit course of MSC-treated patients (blue) and control patients (red). The admission values (ADM) and discharge values (DIS) were compared statistically with nonparametric testing. (A) Horovitz index during the ICU course, (B) plateau pressure in cmH2O, (C) compliance in ml/mmHg, and (D) tidal volume in ml (with n = 5 in the MSC group with 4 out of 5 patients extubated at discharge and n = 18 in the control group with n = 5 extubated at discharge, Mann-Whitney U Test with *P < 0.05).

