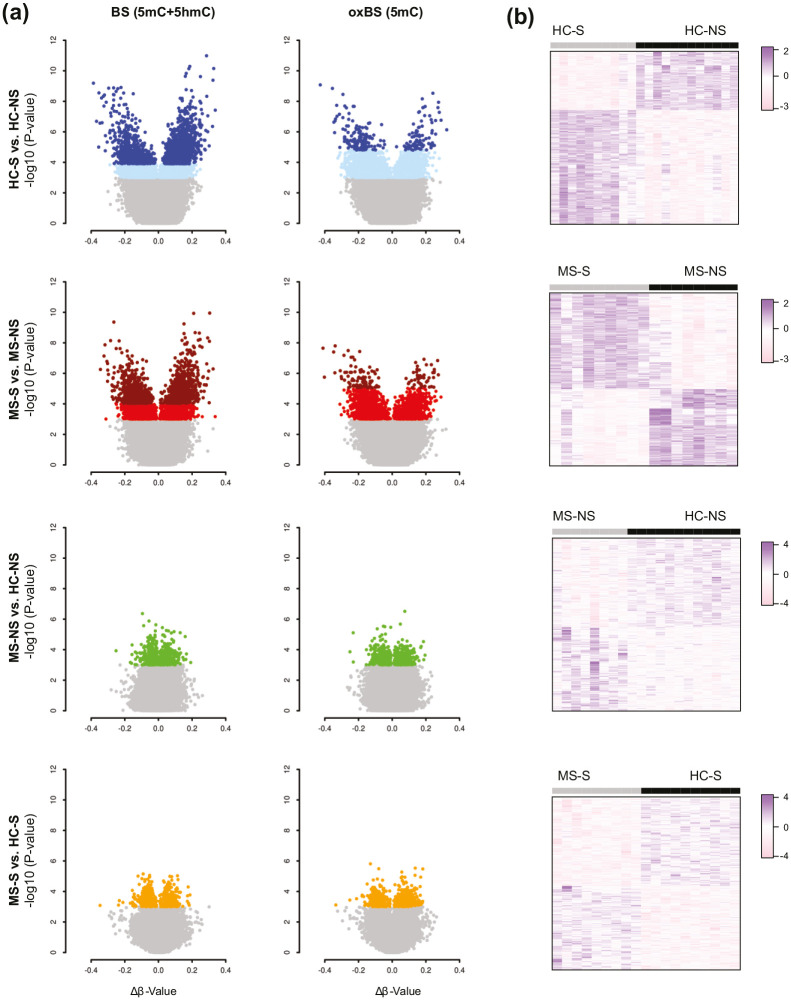
Figure 1.
Smoking-associated methylation changes in bronchoalveolar cells from multiple sclerosis (MS) patients and healthy controls (HC). (a) Volcano plots illustrating, from top to bottom, differences in DNA methylation between smokers and non-smokers in HC (HC-S vs. HS-NS, blue) and in MS patients (MS-S vs. MS-NS, red) and between MS patients and HC, distinguishing non-smokers (MS-NS vs. HC-NS, green) and smokers (MS-S vs. HC-S, orange). Hyper- and hypomethylated CpGs with BH-Padj < 0.05 are indicated in dark colors, while lighter colors represent CpGs with unadjusted P value < 0.001. (b) Heatmaps were generated using the 1000 most significant differentially methylated CpGs between the conditions (the scale represents z-score transformed β-values). Full data are provided in Supplementary Table 2.

