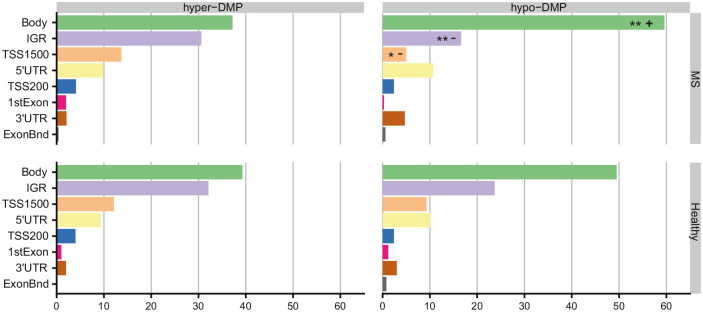
Figure 2.
Distribution of smoking-associated hyper- and hypomethylated CpGs in multiple sclerosis (MS) patients and healthy controls (HCs) across gene features. Horizontal bar plots representing relative frequencies of hyper- and hypomethylated BS-DMPs associated with smoking in MS and HC, shown as percentage (%) across gene features (TSS1500, TSS200, 1stExon, 5ʹUTR, Body, 3ʹUTR, ExonBnd, and IGR). Enrichment/depletion analysis was performed using chi-square test on frequencies, with P values adjusted for multiple testing (Bonferroni).
*Bonferroni-Padj < 0.05 compared to smoking-associated BS-DMP profile in HC
**Bonferroni-Padj compared to smoking-associated BS-DMP profile in HC.
Enriched features are represented by a positive symbol (+) and depleted features are represented by a negative symbol (−).

