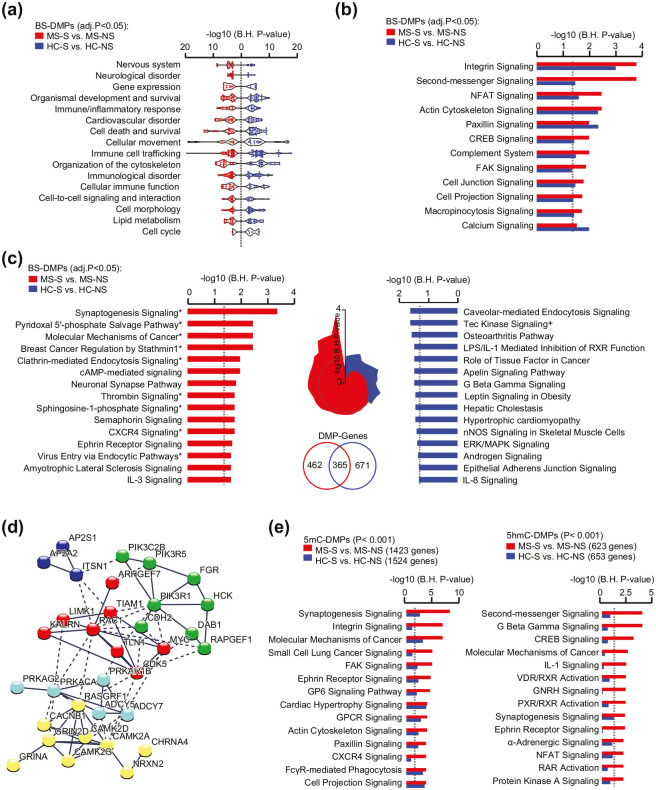
Figure 3.
Functional annotations of genes comprising smoking-associated CpGs in multiple sclerosis (MS) patients and healthy controls (HCs). (a) Enriched categories of Diseases and Biological Functions related to BS-DMP genes (BH-Padj < 0.05) associated with smoking in MS and HC, depicted in red and blue colors, respectively. Of note, terms linked to Cancer were excluded from the visualization. (b) Shared canonical pathways related to BS-DMP (BH-Padj < 0.05) associated with smoking in MS patients (red) and HC individuals (blue). (c) Top canonical pathways related to BS-DMP (BH-Padj < 0.05) genes associated with smoking in MS patient (left panel) or HC (right panel), specifically. Radar chart (middle) indicates the overlap between all specific terms and the dotted line representing the significance threshold. Significant enrichment for BS-DMP genes (BH-Padj < 0.05) identified in MS patients or in HC individuals and not overlapping between the groups are indicated with * or +, respectively, with a Venn diagram numbering the genes. (d) Representation of genes from the Synaptogenesis signaling pathway network using STRING analysis. Gray gradient indicates the strength of data support (darker gray representing stronger evidence) and colors reflect different cluster (kmeans clustering set at 5 clusters). (e) Canonical pathways related to candidate 5mC-DMPs (left panel) and 5hmC-DMPs (right panel) (unadjusted P < 0.001) associated with smoking in MS patients (red) and HC individuals (blue). For all enrichment analyses, significance is represented as −log10 P value after adjustment using Benjamini–Hochberg (BH) correction obtained with ingenuity pathway analysis. Full data are presented in Supplementary Table 4.

