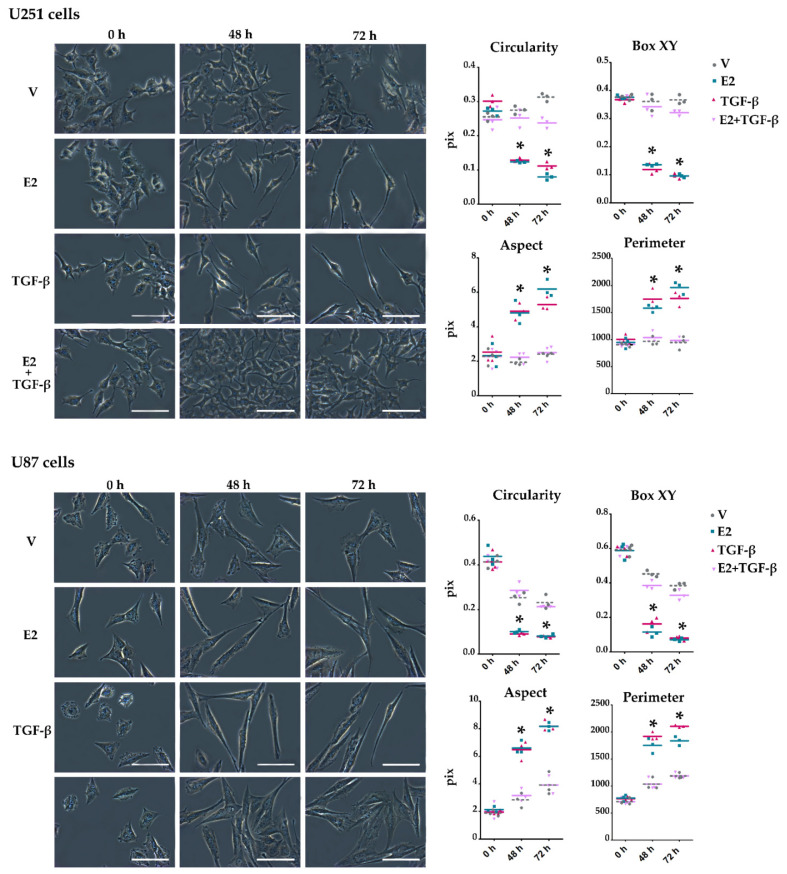
Figure 4.
E2 and TGF-β-induced morphological changes in human GBM-derived cells. Representative images of U251 and U87 cells observed by phase-contrast microscopy at 0, 48, and 72 h after adding vehicle (V, 0.01% cyclodextrin + 0.0001% BSA), E2 (10 nM), TGF-β (10 ng/mL) and E2 + TGF-β. Scale white bars = 100 μm. Plots quantized geometric parameters in this study: circularity, box XY, aspect, and perimeter. Results are expressed as the mean ± standard error of the mean (SEM); n = 3; * p < 0.05 vs. V and E2 + TGF-β.

