Figure 1.
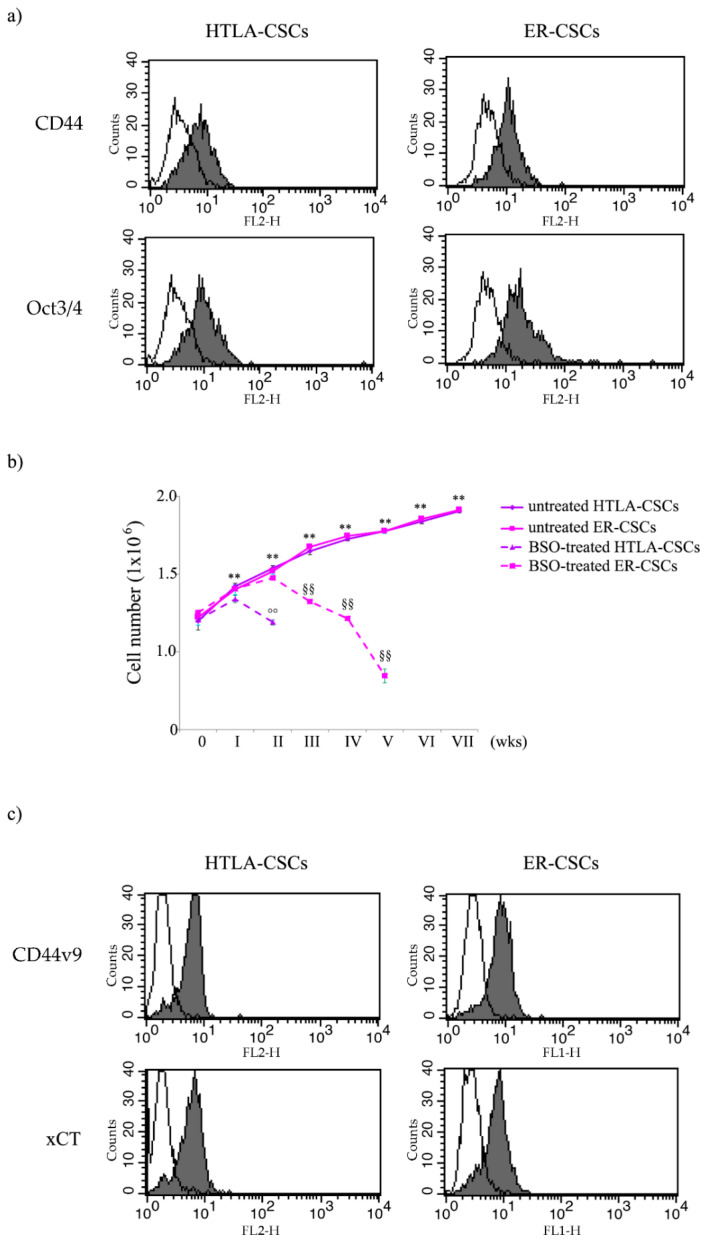
Flow cytometric analysis of CD44, Oct3/4 (a) and of CD44v9 and xCT (c) expression in untreated HTLA-CSCs and ER-CSCs. Cells were permeabilized, stained with mAbs to the indicated molecules, and analyzed by flow cytometry. Grey profiles indicate cells stained with the different mAbs, while white profiles correspond to isotype control. One representative experiment of five is shown. (b) Evaluation of cell number in HTLA-CSCs and ER-CSCs chronically treated with 1mM BSO. Both CSC populations were treated (once a week for six weeks) with 1 mM BSO and, at any split, disaggregated CSCs were counted using a Burker chamber as described in Materials and Methods. ** p < 0.01 vs. time 0; °° p < 0.01 vs. untreated HTLA-CSCs; §§ p < 0.01 vs. untreated ER-CSCs.

