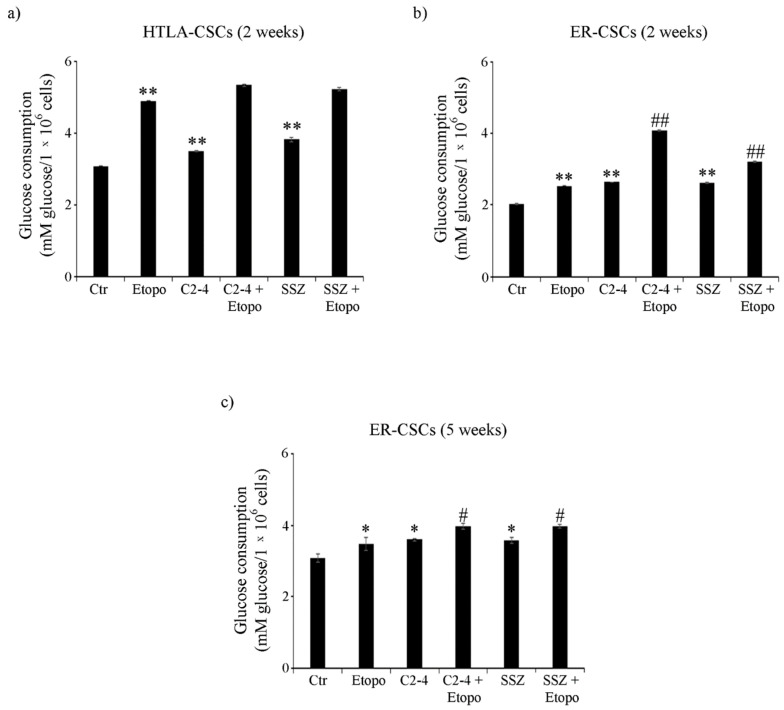
Figure 6.
Glucose consumption in both CSC populations treated for two (a,b) or five weeks (c). HTLA-CSCs and ER-CSCs were treated three times a week with 0.1 µM C2-4, with 5 µM SSZ or with 1.25 µM Etoposide, administered once a week alone or in combination with C2-4 or SSZ. Results were reported as mM glucose/106 cells. Bar graph summarizes quantitative data of means ± S.E.M. of three independent experiments. * p < 0.05 vs. untreated CSCs (Ctr); ** p < 0.01 vs. untreated CSCs (Ctr); # p < 0.05 vs. Etoposide-treated CSCs; ## p < 0.01 vs. Etoposide-treated CSCs.

