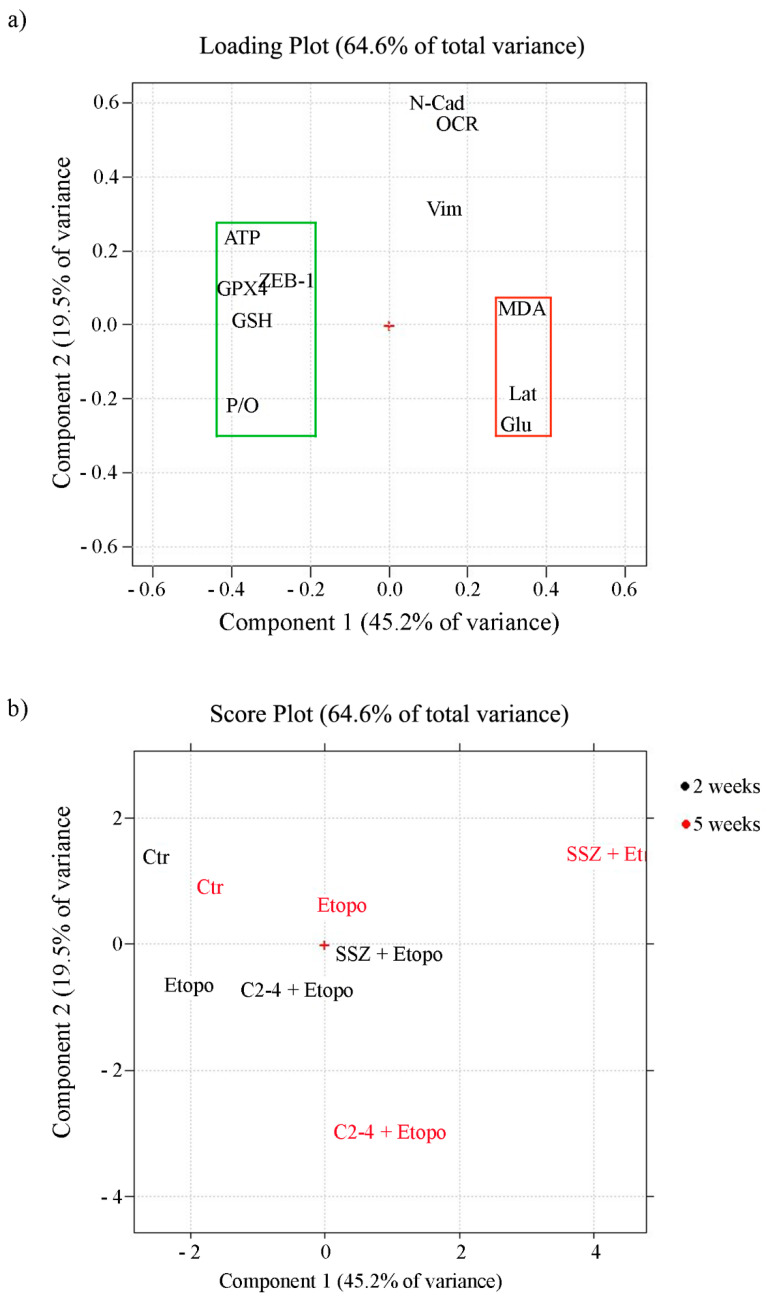
Figure 12.
Loading (a) and score (b) plots. (a) The variables which sustain chemoresistance (green rectangle: ATP, GSH, P/O, ZEB-1, GPX4) have negative loadings on PC1 values, while the variables that are able to induce chemosensitivity (red rectangle: MDA production, lactate release and glucose consumption) have positive loadings on PC1; variables N-CAD, OCR and Vim have instead high loadings on PC2 (b) In the score plot, the black-colored samples were treated for two weeks, while the red-colored ones were treated for five weeks.

