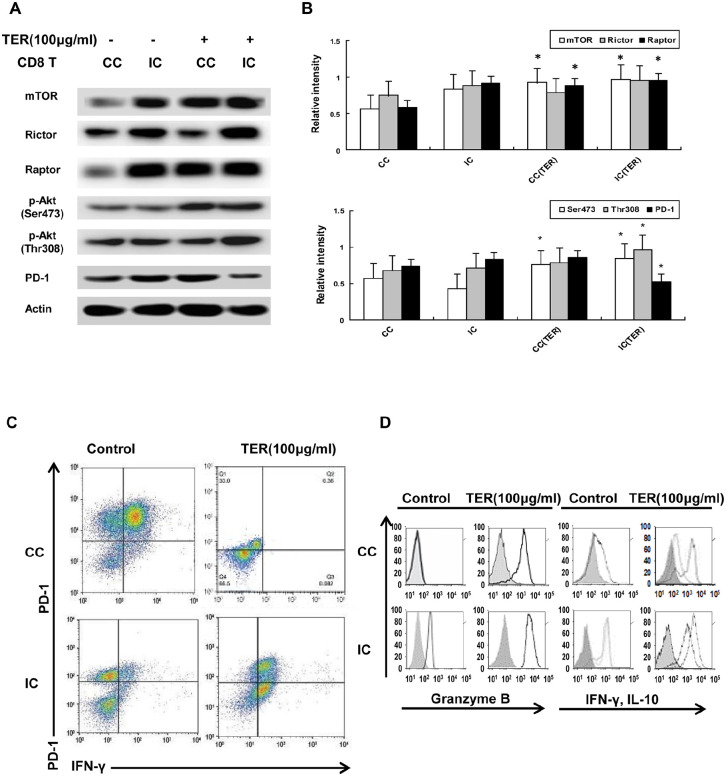
Figure 5.
Effect of TER on Akt/mTOR signaling in effector T-cells. (A and B) The amount of mTOR and phosphorylation of Akt substrates (Ser473 and Thr308) in CD8+ T-cells was detected via Western blot analysis. (C) The expression levels of PD-1 and IFN-γ on CC-CD8+ T-cells were analyzed by flow cytometry. (D) The flow cytometry analysis of IL-10 and IFN-γ production, and the expression of GZMB in CC-CD8+ T-cells with the treatment of TER. Representative results were showed. The percentages of cells were indicated in each quadrant. n = 3 and data was presented as means ± SD.
*P < 0.05, **P < 0.01 compared with the control group.

